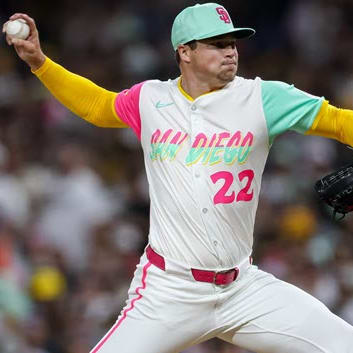
As has been teased for a couple of weeks, I'm going to review some of the pitchers for which I am the high ranker on the RotoWire Roundtable: Fantasy Baseball Top 300 December Update. Instead of using the raw ranking, I'm more focused on the rank within the pitching subsets (starter and reliever).
Starting Pitchers
| Pitcher | Todd | Jeff | Clay | Erik |
|---|---|---|---|---|
| Logan Webb | 5 | 14 | 16 | 8 |
Granted, I'm not that much ahead of Erik, but the delta between early ranking spots is magnified compared to those further down the list. Webb checks all of the boxes for me. In 2022, he made 32 starts covering 192.1 innings and last season he took he hill 33 times for a league-leading 216 frames.
| Season | W | IP | K | ERA | WHIP | LOB% | BABIP | K% | BB% | xFIP | FIP | SIERA |
|---|---|---|---|---|---|---|---|---|---|---|---|---|
| PROJ | 15 | 203 | 187 | 3.15 | 1.13 | 73.5% | 0.303 | 22.9% | 5.4% | |||
| 2023 | 11 | 216 | 194 | 3.25 | 1.07 | 72.6% | 0.303 | 22.8% | 3.6% | 2.95 | 3.16 | 3.16 |
| 2022 | 15 | 192.1 | 163 | 2.90 | 1.16 | 75.9% | 0.294 | 20.7% | 6.2% | 3.31 | 3.03 | 3.56 |
| 2021 | 11 | 148.1 | 158 | 3.03 | 1.11 | 73.5% | 0.312 | 26.5% | 6.0% | 2.79 | 2.72 | 3.13 |
One of the advantages of a formulaic ranking foundation is the valuation process quantifies the effect of volume on ratios. Webb's 3.25 ERA last season was the 10th best among qualified starters. Sure, we're concerned about 2024, but his 2.94 xFIP was second best of all qualified starters, only topped by the 2.92 mark posted by Spencer Strider. Webb's 1.07 WHIP was
As has been teased for a couple of weeks, I'm going to review some of the pitchers for which I am the high ranker on the RotoWire Roundtable: Fantasy Baseball Top 300 December Update. Instead of using the raw ranking, I'm more focused on the rank within the pitching subsets (starter and reliever).
Starting Pitchers
| Pitcher | Todd | Jeff | Clay | Erik |
|---|---|---|---|---|
| Logan Webb | 5 | 14 | 16 | 8 |
Granted, I'm not that much ahead of Erik, but the delta between early ranking spots is magnified compared to those further down the list. Webb checks all of the boxes for me. In 2022, he made 32 starts covering 192.1 innings and last season he took he hill 33 times for a league-leading 216 frames.
| Season | W | IP | K | ERA | WHIP | LOB% | BABIP | K% | BB% | xFIP | FIP | SIERA |
|---|---|---|---|---|---|---|---|---|---|---|---|---|
| PROJ | 15 | 203 | 187 | 3.15 | 1.13 | 73.5% | 0.303 | 22.9% | 5.4% | |||
| 2023 | 11 | 216 | 194 | 3.25 | 1.07 | 72.6% | 0.303 | 22.8% | 3.6% | 2.95 | 3.16 | 3.16 |
| 2022 | 15 | 192.1 | 163 | 2.90 | 1.16 | 75.9% | 0.294 | 20.7% | 6.2% | 3.31 | 3.03 | 3.56 |
| 2021 | 11 | 148.1 | 158 | 3.03 | 1.11 | 73.5% | 0.312 | 26.5% | 6.0% | 2.79 | 2.72 | 3.13 |
One of the advantages of a formulaic ranking foundation is the valuation process quantifies the effect of volume on ratios. Webb's 3.25 ERA last season was the 10th best among qualified starters. Sure, we're concerned about 2024, but his 2.94 xFIP was second best of all qualified starters, only topped by the 2.92 mark posted by Spencer Strider. Webb's 1.07 WHIP was the sixth best among qualified starters, and that included a high .303 BABIP, so it wasn't driven by luck. In terms of the upcoming season, expecting similar ratios over a large number of innings is viable and drives a high ranking.
Webb's 22.9 percent strikeout rate wasn't dominating, but it was two points higher than the previous season, though he did record a lower swinging strike rate. However, his called strikes increased, so his CSW percent was the same as 2023. Even so, this is an area Webb may take a step back. Perhaps my fellow rankers are more worried about this, which can be justified. Even with the innings, Webb's punchouts ranked 18th last season. I can see why some might want more from their fifth-ranked starting pitcher. On the other hand, from a roster construction standpoint, I like banking the low ratio innings to help facilitate streaming.
| Pitcher | Todd | Jeff | Clay | Erik |
|---|---|---|---|---|
| Max Fried | 7 | 15 | 12 | 17 |
Hmm, I need to think about this one. Here is my current projection with the past three seasons' stats:
| Season | W | IP | K | ERA | WHIP | LOB% | BABIP | K% | BB% | xFIP | FIP | SIERA |
|---|---|---|---|---|---|---|---|---|---|---|---|---|
| PROJ | 16 | 177 | 172 | 3.10 | 1.09 | 73.7% | 0.291 | 24.0% | 5.6% | |||
| 2023 | 8 | 77.2 | 80 | 2.55 | 1.13 | 81.5% | 0.310 | 25.7% | 5.8% | 3.10 | 3.14 | 3.38 |
| 2022 | 14 | 185.1 | 170 | 2.48 | 1.01 | 77.8% | 0.280 | 23.2% | 4.4% | 3.09 | 2.70 | 3.31 |
| 2021 | 14 | 165.2 | 158 | 3.04 | 1.09 | 75.2% | 0.281 | 23.7% | 6.1% | 3.45 | 3.31 | 3.76 |
One can argue I'm conservative with the expectation. The problem isn't an overly optimistic performance expectation. However, I think we can all count 177 reasons this is too rosy. Will Atlanta really let Fried toss almost 100 more innings than in 2023 (he threw 12 in rehab)? I think that's at least 20 stanzas too generous.
Cutting Fried from 30 to 26 starts drops his innings to 154, which passes the sniff test. His rank falls to SP11, which still has me a bit ahead of my brethren.
| Pitcher | Todd | Jeff | Clay | Erik |
|---|---|---|---|---|
| Zach Eflin | 16 | 26 | 23 | 20 |
Here is the projection, you tell me if there is anything egregious.
| Season | W | IP | K | ERA | WHIP | LOB% | BABIP | K% | BB% | xFIP | FIP | SIERA |
|---|---|---|---|---|---|---|---|---|---|---|---|---|
| PROJ | 13 | 164 | 160 | 3.46 | 1.09 | 72.0% | 0.295 | 24.2% | 4.2% | |||
| 2023 | 16 | 177.2 | 186 | 3.50 | 1.02 | 69.3% | 0.296 | 26.5% | 3.4% | 3.12 | 3.01 | 3.30 |
| 2022 | 3 | 75.2 | 65 | 4.04 | 1.12 | 66.2% | 0.282 | 20.8% | 4.8% | 3.81 | 3.56 | 3.78 |
| 2021 | 4 | 105.2 | 99 | 4.17 | 1.25 | 70.9% | 0.328 | 22.4% | 3.6% | 3.61 | 3.68 | 3.81 |
I pulled back from last season's strikeout and walk rates. The only factor out of sync with Eflin's history is regressing LOB percent to league average. Especially on the Rays, there is no reason to believe it should be lower than the league average mark.
The ERA projection is supported by the various estimators. One can question the number of innings, but the projection calls for two fewer starts than last season, so it's not unduly optimistic.
I'm good with Eflin where he is, with the caveat that pairing him with Webb yields two non-dominant, low-ratio starters to head up a fantasy staff, which isn't ideal roster construction for a 15-team mixed league but can be manageable in formats with fewer teams.
| Pitcher | Todd | Jeff | Clay | Erik |
| Joe Musgrove | 13 | 30 | 33 | 21 |
Woo boy, what's the deal here?
| Season | W | IP | K | ERA | WHIP | LOB% | BABIP | K% | BB% | xFIP | FIP | SIERA |
|---|---|---|---|---|---|---|---|---|---|---|---|---|
| PROJ | 13 | 168 | 173 | 3.32 | 1.11 | 74.4% | 0.284 | 25.0% | 6.2% | |||
| 2023 | 10 | 97.1 | 97 | 3.05 | 1.14 | 77.2% | 0.305 | 24.3% | 5.3% | 3.70 | 3.52 | 3.77 |
| 2022 | 10 | 181 | 184 | 2.93 | 1.08 | 78.7% | 0.277 | 24.9% | 5.7% | 3.47 | 3.59 | 3.45 |
| 2021 | 11 | 181.1 | 203 | 3.18 | 1.08 | 75.9% | 0.268 | 27.1% | 7.2% | 3.65 | 3.70 | 3.69 |
The innings could be a start or two high, but Musgrove threw 9.1 frames in rehab and would reportedly have been able to return for a start or two at the end of the season had the Padres been in contention. I don't think this reflects the discrepancy.
The projection calls for a slight increase in strikeouts, which could be too sanguine in light of Musgrove's falling swinging and called strike metrics. The left on base mark is a bit above league average, but successful starters can sport a level up to 79 percent. The projected BABIP could be too low, even though Musgrove posted an even lower mark in 2021 and 2022.
Please talk amongst yourselves while I make a couple of tweaks.
OK, I'm back, and I brought this with me.
| PROJ | W | IP | K | ERA | WHIP | LOB% | BABIP | K% | BB% |
|---|---|---|---|---|---|---|---|---|---|
| New | 12 | 162 | 158 | 3.39 | 1.14 | 74.3% | 0.288 | 23.6% | 6.3% |
| Old | 13 | 168 | 173 | 3.32 | 1.11 | 74.4% | 0.284 | 25.0% | 6.2% |
It's not much, but the change is palatable. Musgrove's new ranking is SP20, which keeps me the most confident in Musgrove, but just a tick ahead of Erik.
Looking at the subtlety of the change and how much it affected the rank is a great intellectual exercise. That's all it took to drop Musgrove seven spots in my rankings. This speaks towards not getting hung up on formulaic projections and valuations while giving more credence to ancillary factors such as floor versus ceiling.
| Pitcher | Todd | Jeff | Clay | Erik |
|---|---|---|---|---|
| Jordan Montgomery | 23 | 40 | 37 | 49 |
Montgomery's projection is based on a neutral home park, so his final ranking will adjust accordingly.
| Season | W | IP | K | ERA | WHIP | LOB% | BABIP | K% | BB% | xFIP | FIP | SIERA |
|---|---|---|---|---|---|---|---|---|---|---|---|---|
| PROJ | 13 | 182 | 172 | 3.56 | 1.19 | 72.7% | 0.294 | 22.7% | 6.5% | |||
| 2023 | 10 | 188.2 | 166 | 3.20 | 1.19 | 76.3% | 0.295 | 21.4% | 6.2% | 4.01 | 3.56 | 4.23 |
| 2022 | 9 | 178.1 | 158 | 3.48 | 1.09 | 72.4% | 0.277 | 21.8% | 5.0% | 3.43 | 3.61 | 3.61 |
| 2021 | 6 | 157.1 | 162 | 3.83 | 1.28 | 73.6% | 0.308 | 24.5% | 7.7% | 3.93 | 3.69 | 4.07 |
The projection looks reasonable with nothing out of whack with recent results. The only concern is Montgomery's SIERA has routinely been higher than his xFIP. The two ERA estimators are usually more in sync. SIERA homes in on batted ball distribution, so it could be capturing something xFIP is missing.
Montgomery is still a work in progress, so I don't want to make any changes until the landing point is known. That said, I am sensing a trend.
| Pitcher | Todd | Jeff | Clay | Erik |
|---|---|---|---|---|
| Merrill Kelly | 27 | 46 | 61 | 41 |
Confirmed! It's apparent I have a type. Well, maybe the better way to put it is I am more acceptive of durable but less dominant starters.
| Season | W | IP | K | ERA | WHIP | LOB% | BABIP | K% | BB% | xFIP | FIP | SIERA |
|---|---|---|---|---|---|---|---|---|---|---|---|---|
| PROJ | 13 | 185 | 162 | 3.65 | 1.19 | 73.0% | 0.290 | 23.7% | 7.9% | |||
| 2023 | 12 | 177.2 | 143 | 3.29 | 1.19 | 76.6% | 0.279 | 25.9% | 9.6% | 3.83 | 3.85 | 4.12 |
| 2022 | 13 | 200.1 | 167 | 3.37 | 1.14 | 73.9% | 0.269 | 22.0% | 7.6% | 3.86 | 3.65 | 4.01 |
| 2021 | 7 | 158 | 163 | 4.44 | 1.29 | 68.9% | 0.305 | 19.5% | 6.1% | 4.24 | 4.11 | 4.43 |
The ERA estimators suggest his projected ERA could be a bit higher, which is easily accomplished by dropping the LOB mark to 72 percent, but I'm still going to be receptive to having a pitcher of Kelly's ilk on my fantasy staff. As mentioned already, the key is to not overload your roster with this type of starter, just as a sage drafter wouldn't continue to draft stolen base guy after stolen base guy.
| Pitcher | Todd | Jeff | Clay | Erik |
|---|---|---|---|---|
| Eduardo Rodriguez | 30 | 59 | 48 | 43 |
The update was posted before Rodriguez signed with the Diamondbacks. Here is the initial projection driving the ranking, along with the new one.
| Season | W | IP | K | ERA | WHIP | LOB% | BABIP | K% | BB% | xFIP | FIP | SIERA |
|---|---|---|---|---|---|---|---|---|---|---|---|---|
| Old PROJ | 12 | 180 | 177 | 3.70 | 1.20 | 72.1% | 0.289 | 23.8% | 7.5% | |||
| New PROJ | 12 | 180 | 175 | 3.60 | 1.21 | 72.5% | 0.295 | 23.5% | 7.4% | |||
| 2023 | 13 | 152.2 | 143 | 3.30 | 1.15 | 74.5% | 0.275 | 23.0% | 7.7% | 4.06 | 3.66 | 4.26 |
| 2022 | 5 | 91 | 72 | 4.05 | 1.33 | 73.4% | 0.279 | 18.4% | 8.7% | 4.41 | 4.43 | 4.56 |
| 2021 | 13 | 157.2 | 185 | 4.74 | 1.39 | 68.0% | 0.364 | 27.4% | 7.0% | 3.43 | 3.32 | 3.65 |
Hmm, maybe the ERA is a little aggressive based on the estimators, but it can be justified. The bigger sore thumb is the innings. Anticipating 30 starts from Rodriguez is a bit over the top. He's capable, and is certainly a plausible outcome, but to peg it the likely outcome is overly optimistic.
Dropping Rodriguez to 27 starts (168 innings) feels better. Let's see what happens to his rank... OK, carry the one and... SP35. Again, I am still the high ranker, but I'm closer to the pack, and Rodriguez is another example of a less dominant guy, though a couple of tiers below the previous pitchers.
| Pitcher | Todd | Jeff | Clay | Erik |
|---|---|---|---|---|
| Bailey Ober | 19 | 55 | 82 | 46 |
This one should be fun.
| Season | W | IP | K | ERA | WHIP | LOB% | BABIP | K% | BB% | xFIP | FIP | SIERA |
|---|---|---|---|---|---|---|---|---|---|---|---|---|
| PROJ | 12 | 160 | 164 | 3.49 | 1.08 | 72.1% | 0.295 | 25.8% | 5.0% | |||
| 2023 | 8 | 144.1 | 146 | 3.43 | 1.07 | 75.0% | 0.276 | 25.3% | 5.0% | 4.20 | 3.96 | 3.87 |
| 2022 | 2 | 56 | 51 | 3.21 | 1.05 | 70.9% | 0.278 | 22.5% | 4.8% | 4.18 | 2.92 | 3.99 |
| 2021 | 3 | 92.1 | 96 | 4.19 | 1.20 | 74.7% | 0.296 | 25.3% | 5.0% | 4.01 | 4.56 | 3.82 |
Maybe the strikeout rate is a smidge high, but it's supported by Ober's swinging strike mark. The ERA is out of sync with the expected levels. Saying he's beat the estimates for three years isn't sufficient to justify doing it again. However, Ober's BABIP and LOB% have been set to league average and the ERA is still lower than the expected marks, but it's higher than it's been the prior two campaigns. Is it cheery? Sure, but it's defensible.
The primary question is playing time. Even in the midst of a seemingly solid season, Ober was sent to Triple-A St. Paul last year. The Twins opted to give the ball to Dallas Keuchel for six starts instead of Louie Varland, who was pitching well on the farm. Can they be trusted to send Ober to the hill every fifth day?
Pablo Lopez and Joe Ryan are the only Twins starters assured of an Opening Day rotation spot. Currently, Ober has competition from Chris Paddack, Varland and Simeon Woods Richardson. Obviously, Minnesota can bring in another starter or two, but Ober's starting spot seems safe.
That's my ranking, and I'm sticking to it.
Closers
| Name | Todd | Jeff | Clay | Erik |
|---|---|---|---|---|
| Raisel Iglesias | 2 | 10 | 12 | 7 |
| Season | W | SV | IP | K | ERA | WHIP | LOB% | BABIP | K% | BB% | xFIP | FIP | SIERA |
|---|---|---|---|---|---|---|---|---|---|---|---|---|---|
| PROJ | 4 | 37 | 61 | 74 | 2.95 | 1.07 | 77.6% | 0.295 | 30.1% | 5.7% | |||
| 2023 | 5 | 33 | 55.2 | 68 | 2.75 | 1.19 | 83.1% | 0.312 | 29.4% | 6.5% | 3.31 | 3.26 | 3.06 |
| 2022 | 2 | 17 | 62 | 78 | 2.47 | 0.97 | 78.2% | 0.285 | 31.7% | 5.7% | 2.99 | 2.47 | 2.46 |
| 2021 | 7 | 34 | 70 | 103 | 2.57 | 0.93 | 83.3% | 0.290 | 37.7% | 4.4% | 2.30 | 2.83 | 2.06 |
I've reviewed this projection a gazillion times. It seems to be fair. However, Iglesias will be 34 years old, and durability is a question. Most importantly, friend and colleague Eno Sarris from The Athletic has expressed concern over Iglesias' stuff. I'll probably look at this projection another gazillion times, but for now I'm leaving it alone.
| Name | Todd | Jeff | Clay | Erik |
|---|---|---|---|---|
| Paul Sewald | 11 | 18 | 20 | 17 |
The significance of these relative ranks is I would be fine with Sewald as my CL1 in a 12- or 15-team mixed league while my colleagues view him more as a CL2.
| Season | W | SV | IP | K | ERA | WHIP | LOB% | BABIP | K% | BB% | xFIP | FIP | SIERA |
|---|---|---|---|---|---|---|---|---|---|---|---|---|---|
| PROJ | 2 | 37 | 64 | 79 | 3.38 | 1.16 | 76.9% | 0.286 | 30.0% | 8.7% | |||
| 2023 | 3 | 34 | 60.2 | 80 | 3.12 | 1.15 | 79.0% | 0.284 | 32.1% | 9.6% | 3.76 | 3.57 | 3.23 |
| 2022 | 5 | 20 | 64 | 72 | 2.67 | 0.77 | 76.9% | 0.159 | 29.8% | 7.0% | 3.58 | 3.88 | 2.89 |
| 2021 | 10 | 11 | 64.2 | 104 | 3.06 | 1.02 | 78.6% | 0.256 | 39.4% | 9.1% | 3.00 | 3.08 | 2.48 |
This could be a subjective call. I see Sewald as the guy in the desert. At least for now, the competition is the same as it was last year: Scott McGough, Kevin Ginkel and Miguel Castro. Playoff struggles aside, Sewald is the clear-cut option. There was chatter at the recent First Pitch Arizona how he could have been hampered by multiple appearances against the same team, but for the regular season, he should be fine.
| Name | Todd | Jeff | Clay | Erik |
|---|---|---|---|---|
| Adbert Alzolay | 7 | 16 | 17 | 18 |
This is absolutely a subjective call, as I am clearly projecting Alzolay to be the Cubs' season-long closer.
| Season | W | SV | IP | K | ERA | WHIP | LOB% | BABIP | K% | BB% | xFIP | FIP | SIERA |
|---|---|---|---|---|---|---|---|---|---|---|---|---|---|
| PROJ | 3 | 34 | 66 | 71 | 3.41 | 1.06 | 72.6% | 0.292 | 26.8% | 4.9% | |||
| 2023 | 2 | 22 | 64 | 67 | 2.67 | 1.02 | 76.7% | 0.290 | 26.5% | 5.1% | 3.56 | 3.02 | 3.21 |
| 2022 | 2 | 0 | 13.1 | 19 | 3.38 | 0.83 | 60.0% | 0.276 | 36.5% | 3.8% | 2.27 | 1.91 | 1.78 |
| 2021 | 5 | 1 | 125.2 | 128 | 4.58 | 1.16 | 67.8% | 0.270 | 24.7% | 6.6% | 3.66 | 4.65 | 3.81 |
If you've been reading the recent series regarding my roundtable rankings, you may have spotted the same inconsistency in my process that I just realized as I was pasting in the above data. It's my job to make calls like pegging Alzolay as the Cubs closer. However, expecting him to keep the job all season is not the average of all plausible outcomes; it's the best-case scenario. I need to account for other scenarios.
When projecting saves, I assign the percentage of saves I expect from the reliever. In stable bullpens, it's based on history. In unsettled bullpens, I gauge the chance each reliever ends up as the closer. If I feel there is a 25 percent chance the reliever wins the closer job, he gets assigned 25 percent of the saves.
Alzolay was assigned 85 percent of the Cubs saves, which is the standard allotment for full-time closers since not all the saves go to the same individual. Even if I believe Alzolay will be the Cubs closer, 85 percent does not represent a weighted average of all plausible outcomes.
While I don't believe the Cubs will bring anyone else in, there are some closers on the market, so the possibility exists. Lowering Alzolay to 70 percent reflects the chance he isn't the primary closer as well as the possibility he struggles with the role and loses it. An allocation over 50 percent reflects my strong inclination as to Alzolay's role. The corresponding 30 saves drops him to CL13, so I am still quite bullish. If the Cubs don't bring anyone else in, the share will increase to 75 or 80 percent since there is still a chance Alzolay loses the gig.
Next time: Pitchers I Rank Lowest


