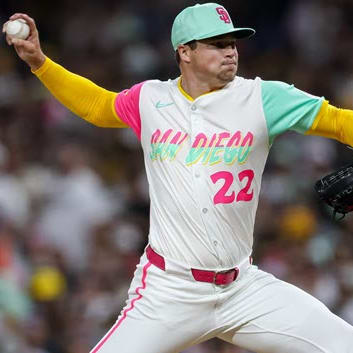
I wanted to get in one topical article before rolling up my sleeves and beginning the annual bold prediction series, so I went to my idea Notes file on my phone to look at thoughts I had jotted down during playoff baseball. One particular idea jumped out at me: workload hangover. I had jotted that down after thinking about how the deep push into the postseason was going to impact Zac Gallen as he finished the 2023 season throwing 243.2 innings between the regular and postseason of work. Gallen's workload increased 32.4 percent on the surface if we treat all innings as equal, but many a pitcher has admitted that the stress of postseason innings is a multiplier to pitching workloads.
Before diving into this, I wanted to limit the work to recent seasons given the disruption of what the pandemic did to the 2020 and 2021 seasons. Therefore, the data below will focus on pitchers on the past five full seasons, with 2020 and 2021 thrown out the window. I don't know what the data will show us, as I'm typing this introduction up before digging into the data, so my hypothesis is that there is a workload hangover from one season to the next for most (not all) pitchers and that fantasy managers should be more cognizant of it than they typically are at the draft table. Let's find out if my hypothesis is on the right track or much ado about nothing.
I would be remiss if
I wanted to get in one topical article before rolling up my sleeves and beginning the annual bold prediction series, so I went to my idea Notes file on my phone to look at thoughts I had jotted down during playoff baseball. One particular idea jumped out at me: workload hangover. I had jotted that down after thinking about how the deep push into the postseason was going to impact Zac Gallen as he finished the 2023 season throwing 243.2 innings between the regular and postseason of work. Gallen's workload increased 32.4 percent on the surface if we treat all innings as equal, but many a pitcher has admitted that the stress of postseason innings is a multiplier to pitching workloads.
Before diving into this, I wanted to limit the work to recent seasons given the disruption of what the pandemic did to the 2020 and 2021 seasons. Therefore, the data below will focus on pitchers on the past five full seasons, with 2020 and 2021 thrown out the window. I don't know what the data will show us, as I'm typing this introduction up before digging into the data, so my hypothesis is that there is a workload hangover from one season to the next for most (not all) pitchers and that fantasy managers should be more cognizant of it than they typically are at the draft table. Let's find out if my hypothesis is on the right track or much ado about nothing.
I would be remiss if I did not remind you that all innings are not created equal. Innings pitched is the quick and easy way to look at workloads, but total pitches thrown is readily available on the Fangraphs leaderboards. In fact, I went ahead and created a custom leaderboard you can use for your own edification and you would just need to toggle the season filter in the gray area on the menu.

Logan Webb led all pitchers with 216 innings pitched during the regular season. Miles Mikolas led all pitchers with 860 batters faced, while Gerrit Cole threw the most pitches (3,286). However, Dylan Cease came in second with 3,263 pitches despite throwing 29 fewer regular season innings! Cease "led" all pitchers with 18.4 pitches thrown per inning as well. One might assume that Cease was the leader in pitches thrown per batter faced last year, but you would be wrong, as he was only fifth on that list. The leader...won the NL Cy Young, as Blake Snell needed an average of 4.3 pitches per batter faced. In short, you can see why simply focusing on innings for workload measurement is not an exact science.
Knowing that, I would like to begin this exercise by looking at the 2017 season and who the categorical leaders were in those seasons. I am focusing only on pitchers who qualified for the ERA title that season (min. 162 IP) and then merging their postseason workload numbers onto their regular season numbers if that pitcher did any postseason work.
2017
Leaders by Innings Pitched
PITCHER | 2017 TOTAL IP | 2018 REG SEASON IP |
|---|---|---|
242.2 | 214.0 | |
224.0 | 158.0 | |
213.1 | 24.2 | |
211.0 | 207.2 | |
210.0 | 215.0 |
Leaders by Pitches Thrown
PITCHER | 2017 TOTAL PITCHES | 2018 REG SEASON PITCHES |
|---|---|---|
4,065 | 3,427 | |
3,605 | 2,525 | |
Rick Porcello | 3,465 | 3,096 |
3,423 | 2,908 | |
Jon Lester | 3,375 | 3,121 |
Leaders by Total Batters Faced
PITCHER | 2017 TOTAL BATTERS FACED | 2018 REG SEASON TOTAL BATTERS FACED |
|---|---|---|
985 | 833 | |
Rick Porcello | 905 | 808 |
894 | 617 | |
875 | 114 | |
851 | 780 |
Verlander clearly had no issues transferring his immense workload from 2017 over into the next season, nor did most other pitchers. Sale is the biggest takeaway here as he missed time with a shoulder injury, while Santana's significant time was related to a finger injury.
2018
Leaders by Innings Pitched
PITCHER | 2018 TOTAL IP | 2019 REG SEASON IP |
|---|---|---|
231.1 | 223.0 | |
220.2 | 172.1 | |
219.2 | 35.2 | |
217.0 | 204.0 | |
214.2 | 112.2 |
Leaders by Pitches Thrown
PITCHER | 2018 TOTAL PITCHES | 2019 REG SEASON PITCHES |
|---|---|---|
3,716 | 3,448 | |
3,493 | 2,770 | |
3,472 | 1,864 | |
3,445 | 3,362 | |
3,364 | 2,090 |
Leaders by Total Batters Faced
PITCHER | 2019 TOTAL BATTERS FACED | 2019 REG SEASON TOTAL BATTERS FACED |
|---|---|---|
915 | 487 | |
904 | 847 | |
Rick Porcello | 872 | 768 |
James Shields | 871 | 0 |
868 | 473 |
The Klubot broke down after two consecutive seasons of heavy lifting, while Keuchel fell victim to the compensation pick troubles when no club would sign the free agent under the old rules until that pick penalty cleared. Keuchel ended up missing the first two and a half months of 2019. Shields retired, while Freeland went into a tailspin that saw him back in Triple-A for a chunk of the 2019 season.
Now comes time for the COVID-19 curveball as we will skip the 2019-2020 seasons and fast forward to look at what happened from 2021 to 2022 and then finally 2022 to this past season.
2021
Leaders by Innings Pitched
PITCHER | 2021 TOTAL IP | 2022 REG SEASON IP |
|---|---|---|
226.0 | 65.0 | |
213.1 | 153.0 | |
Adam Wainwright | 211.2 | 191.2 |
205.2 | 228.2 | |
203.0 | 109.1 |
Leaders by Pitches Thrown
PITCHER | 2021 TOTAL PITCHES | 2022 REG SEASON PITCHES |
|---|---|---|
3,475 | 1,046 | |
3,281 | 2,903 | |
3,251 | 1,739 | |
3,205 | 2,358 | |
3,196 | 2,101 |
Leaders by Total Batters Faced
PITCHER | 2021 TOTAL BATTERS FACED | 2022 REG SEASON TOTAL BATTERS FACED |
|---|---|---|
898 | 274 | |
851 | 460 | |
849 | 607 | |
Adam Wainwright | 849 | 803 |
837 | 886 |
Uh, whose idea was it to allow a 25-26 year old pitcher to lead the league in all three of these metrics? Especially one who had thrown 61.2 innings the season before? The list of pitchers of a similar age and workload has many notable names and many notable injuries related to those names. Wheeler missed time with forearm tendonitis while Eovaldi also missed time with arm-related issues. Mahle also missed tim with shoulder inflammation, which cut into his ability to repeat his 2021 workload.
2022
Leaders by Innings Pitched
PITCHER | 2022 TOTAL IP | 2023 REG SEASON IP |
|---|---|---|
230.2 | 193.2 | |
228.2 | 184.2 | |
226.1 | 198.0 | |
219.2 | 136.1 | |
219.0 | 209.0 |
Leaders by Pitches Thrown
PITCHER | 2022 TOTAL PITCHES | 2023 REG SEASON PITCHES |
|---|---|---|
3,581 | 3,286 | |
3,459 | 3,094 | |
3,408 | 2,962 | |
3,357 | 2,219 | |
3,274 | 3,081 |
Leaders by Total Batters Faced
PITCHER | 2022 TOTAL BATTERS FACED | 2023 REG SEASON TOTAL BATTERS FACED |
|---|---|---|
923 | 808 | |
919 | 793 | |
886 | 762 | |
872 | 574 | |
870 | 821 |
Darvish struggled with back and hip soreness in 2022 and his issues have lingered, leading to elbow surgery to remove a bone spur this past season. Alcantara, after appearing on the leaderboard in back-to-back seasons, was not the same pitcher in 2023 and ended up having Tommy John surgery in October, taking him out for the 2024 season.
What happened in 2023?
Leaders by Innings Pitched
PITCHER | 2023 TOTAL IP |
|---|---|
243.2 | |
219.2 | |
219.2 | |
216.2 | |
216.0 |
Leaders by Pitches Thrown
PITCHER | 2023 TOTAL PITCHES |
|---|---|
3,799 | |
3,560 | |
3,438 | |
3,383 | |
3,290 |
Leaders by Total Batters Faced
PITCHER | 2023 TOTAL BATTERS FACED |
|---|---|
987 | |
912 | |
890 | |
882 | |
869 |
Gallen ascends the throne recently held by Buehler two seasons ago, albeit accomplishing the feat a year older as he pulled off the workload triple crown in his age-27 season. Nola has now been on the innings pitched leaderboard in consecutive seasons and appeared on all three leaderboards just as Verlander did in the 2018 and 2019 seasons. Yes, Verlander went down with Tommy John surgery in 2020 early on, but the conditions of that season make it tough to draw any correlation. Note that Alcantara avoided the pitches thrown leaderboard in both of his seasons prior to injury and yet still struggled this past season, eventually succumbing to injury.
In conclusion, I don't see enough here to make any type of definitive statement on the effects of extreme workload hangovers. However, between Gallen's heavy lifting and Montgomery likely signing a big new contract somewhere other than Texas because of the budgetary uncertainty regarding the team's broadcast rights (they're a Bally Sports-affiliated club), I can absolutely see myself fading the entirety of the 2023 leaderboards, especially given my gut feeling on Strider with his 48.7 percent workload increase year over year and the 41.2 percent increase in his pitch count. The starting pitching market is already thin on options given the carryover from last year's notable injuries, so I will likely be looking for the next ace rather than turning to last year's aces that are not named Gerrit Cole.
I've signed up for my first NFBC draft in a $150 Draft Champions League on January 2nd at 8pm. It's an express, so 55 seconds between picks! If you would like to join the league, all the other spots remain open.


