"Facts are stubborn, but statistics are more pliable." – Mark Twain
"There are three kinds of lies: lies, damned lies, and statistics." - Benjamin Disraeli
"I can prove anything by statistics except the truth." - George Canning
Statistics are both fun and dangerous at the same time. They are fun because they can help you prove or disprove what your mind believes or what your eyes see. They are dangerous because pretty much any statistic can be twisted to fit a particular point of view.
Earlier this week, John Dewan had a brief post over on his blog at ACTASports that covered the topic of throwing strikes. The general line of thought is that pitchers who throw more strikes will have a better ERA than their peers who throw a lower percentage of pitches in the strike zone. The post went on to explain that there were 81 pitchers that qualified for the ERA title in 2013 (min 162 IP) and he created four tiers of pitchers. Three groups had 20 while the final group had the 81st pitcher. These were the percentage of pitches each group threw in the strike zone (Zone%) and the ERA of each group:
| Group | Zone% | ERA |
| Group A | 47.60% | 3.27 |
| Group B | 44.80% | 3.52 |
| Group C | 43.40% | 3.70 |
| Group D | 40.80% | 3.91 |
Based on that data, it would seem that it would be easy to identify pitchers with strong ERA's if we simply targeted the pitchers that threw a high percentage of pitches in
"Facts are stubborn, but statistics are more pliable." – Mark Twain
"There are three kinds of lies: lies, damned lies, and statistics." - Benjamin Disraeli
"I can prove anything by statistics except the truth." - George Canning
Statistics are both fun and dangerous at the same time. They are fun because they can help you prove or disprove what your mind believes or what your eyes see. They are dangerous because pretty much any statistic can be twisted to fit a particular point of view.
Earlier this week, John Dewan had a brief post over on his blog at ACTASports that covered the topic of throwing strikes. The general line of thought is that pitchers who throw more strikes will have a better ERA than their peers who throw a lower percentage of pitches in the strike zone. The post went on to explain that there were 81 pitchers that qualified for the ERA title in 2013 (min 162 IP) and he created four tiers of pitchers. Three groups had 20 while the final group had the 81st pitcher. These were the percentage of pitches each group threw in the strike zone (Zone%) and the ERA of each group:
| Group | Zone% | ERA |
| Group A | 47.60% | 3.27 |
| Group B | 44.80% | 3.52 |
| Group C | 43.40% | 3.70 |
| Group D | 40.80% | 3.91 |
Based on that data, it would seem that it would be easy to identify pitchers with strong ERA's if we simply targeted the pitchers that threw a high percentage of pitches in the strike zone. If it were only that easy.
Utilizing the pitching correlation tool recently published at Fangraphs, we find that the correlation between ERA and Zone% is overall, very low. The tool spits out that the base correlation for the two stats is -0.048 over 709 examples of pitchers working at least 100 innings in a season from 2009 through 2013. In case you do not know, that's a very weak correlation.
If we break the results down to all qualified starting pitchers as well as all relievers that threw at least 50 innings in a given season, the r2 results are not any better.
| Season | Starters IP=>162 | Relievers IP >=50 |
| 2009 | 0.074 | 0.004 |
| 2010 | 0.016 | 0.005 |
| 2011 | 0.038 | 0.002 |
| 2012 | 0.000 | 0.001 |
| 2013 | 0.157 | 0.000 |
Note that the year to year correlations are not consistent. That said, it is worth noting that the correlation in 2013 for starting pitchers was the strongest it has been over the past five seasons and double what it was in 2009.
There are several examples as to why the correlation is so weak are Clayton Kershaw and CC Sabathia. Kershaw's Zone% in 2013 was 52.3% and he had the lowest ERA in all of baseball at 1.83. Sabathia's Zone% was slightly higher at 52.7%, but his ERA was much higher at 4.78. Zack Greinke had a 46.4 Zone% yet posted a 2.63 ERA while Jeremy Hellickson's 48.1 Zone% paired with a 5.24 ERA.
While throwing strikes is important, getting strikeouts is more important if you are looking for pitchers with lower ERA. Last season, the correlation between ERA and strikeout rate (K%) was 0.253. It is a small positive correlation, but it is still stronger than the correlation between Zone% and ERA. The same tool referenced earlier from Fangraphs gives us a base correlation of -0.479, meaning the higher the K%, the lower the ERA reviewing a sample size of 709 pitchers that worked at least 100 innings in a season over the past five seasons.
After all, strikeouts are one of the strongest stats in terms of year-to-year correlation. If you want to pick a stat to evaluate pitchers as you plan your 2014 draft lists, this is how the different metrics correlated from year to year in 2002-2012 as calculated by Matt Klaassen of Fangraphs.
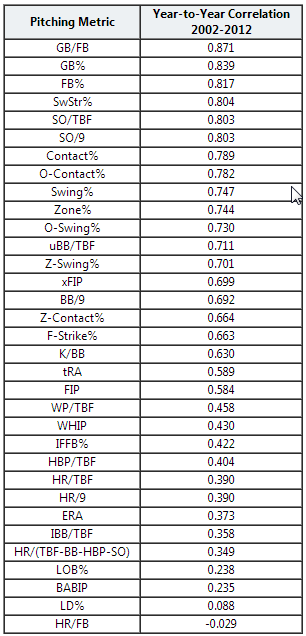
Keep that in mind as you read or listen to people who are optimistic or pessimistic about a pitcher based on 2013 ERA's, BABIP's, or LOB% rates. Stay away from analysis based on volatile statistics and look at pitchers based on statistics that show strong year to year correlation. No statistic is perfect, and any statistic can be twisted, but some metrics are much more flawed than others.