
A favorite topic around the sports industry is debating whether certain teams are "soft" and whether that is to blame for any shortcoming in a given season. With that in mind, RotoWire set out to determine which NBA teams are the "softest" and whether the created metric can accurately reflect a team's win-loss record. The metric is based on four criteria, which leads to a total rank of "softness." Those four criteria are: man games missed, technical fouls per game, opponent points per game allowed in the paint and games lost by 20 points or more. (All information found prior to Feb. 25.)
With that in mind, let's dive into the data to figure out which criteria matter to earning victories and which do not.
Rank | Team | "Man Games Missed" Rank | "Technical Fouls" Rank | "Opponent Points In Paint" Rank | "Games Lost Over 20+" Rank | Average Rank |
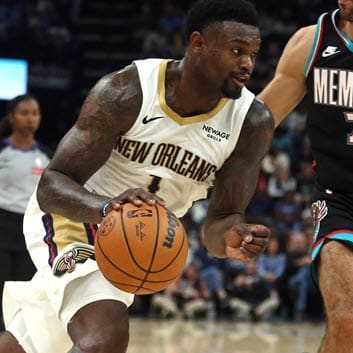
1 | New Orleans Pelicans | 25th | 29th | 29th | 9th | 27.75 |
2 | Washington Wizards | 14th | 20th | 28th | 30th | 23.00 |
3 | Los Angeles Lakers | 25th | 20th | 21st | 25th | 22.75 |
4 | Toronto Raptors | 21st | 20th | 22nd | 26th | 22.25 |
5 | Indiana Pacers | 19th | 20th | 28th | 20th | 21.75 |
6 | Atlanta Hawks | 26th | 9th | 26th | 25th | 21.50 |
T-7 | Portland Trail Blazers | 15th | 29th | 12th | 29th | 21.25 |
T-7 | Charlotte Hornets | 29th | 20th | 16th | 20th | 21.25 |
9 | Chicago Bulls | 13th | 20th | 30th | 20th | 20.75 |
10 | Philadelphia 76ers | 22nd | 20th | 19th | 20th | 20.25 |
11 | Utah Jazz | 20th | 20th | 11th | 28th | 19.75 |
12 | New York Knicks | 11th | 29th | 23rd | 13th | 19.00 |
13 | Denver Nuggets | 17th | 20th | 25th | 13th | 18.75 |
T-14 | Los Angeles Clippers | 16th | 29th | 4th | 25th | 18.50 |
T-14 | Dallas Mavericks | 23rd | 20th | 24th | 7th | 18.50 |
16 | Miami Heat | 11th | 29th | 18th | 13th | 17.75 |
17 | Phoenix Suns | 8th | 29th | 20th | 13th | 17.50 |
18 | Sacramento Kings | 5th | 29th | 10th | 25th | 17.25 |
19 | Brooklyn Nets | 30th | 4th | 14th | 20th | 17.00 |
20 | Milwaukee Bucks | 6th | 30th | 6th | 20th | 15.50 |
21 | Memphis Grizzlies | 28th | 9th | 15th | 7th | 14.75 |
22 | Oklahoma City Thunder | 27th | 29th | 1st | 1st | 14.50 |
23 | Cleveland Cavaliers | 13th | 29th | 10th | 4th | 14.00 |
24 | Orlando Magic | 18th | 3rd | 4th | 25th | 12.50 |
25 | San Antonio Spurs | 1st | 9th | 14th | 14th | 9.50 |
26 | Boston Celtics | 4th | 20th | 7th | 4th | 8.75 |
27 | Golden State Warriors | 9th | 9th | 2nd | 13th | 8.25 |
28 | Minnesota Timberwolves | 7th | 9th | 10th | 5th | 7.75 |
29 | Houston Rockets | 3rd | 1st | 17th | 4th | 6.25 |
30 | Detroit Pistons | 2nd | 3rd | 5th | 13th | 5.75 |
Technical Fouls Per Game
The number of technical fouls per game by team range from 0.1 to 0.7, though the median is 0.3 and the mean .2944. The bottom line is that there is no evidence that technical fouls have anything to do with winning, as the two have an r-squared of -.04. Put another way, there are 15 teams in playoff position clear of the play-in tournament. Of those 15, five averaged at least 0.4 technical fouls per game. Drilling down a bit further, Houston leads the league with 0.7 technical fouls per game, yet is five games clear of the play-in tournament with a record of 37-23.
Man Games Missed
Man games missed have more of an impact on the outcome of games with an r-squared of -.236. The median number of games missed per team is 166 and the mean 149.61. Using the same 15-team sample, seven have more man games missed than the median and mean. The range of games missed is a bit more intriguing, as the Spurs have the fewest man games missed with 75 and the Nets the most with 297. Seven of the 11 teams with the most missed games are in the play-in tournament or worse. Of the teams with the 19 fewest man games missed, 11 are among the top six seeds in their conference.
Opponent Points Per Game Inside the Paint
The days of bruising big men such as Shaquille O'Neal may be behind us, but getting the ball into the paint and around the basket is still one of the most efficient ways to put up points. It doesn't come as much surprise that the r-squared for opponent points per game inside the paint allowed rises to -.3984. Four of the five worst-ranked teams in the category are in the play-in tournament or worse. Meanwhile, eight of the 10 teams with the fewest opponent points per game allowed inside the paint are a top-six seed in their conference. The three worst teams at defending around the rim are the Bulls, Pelicans and Wizards, who have a combined record of 52-129. The three ball may get the highlights, but interior defense is still a key to team success.
Games Lost by 20+
It may not come as much of a surprise that blowout losses are most common among teams with the most overall losses. The r-squared between wins and games lost by 20 or more points is -.6968. The two teams with an outlier number of blowout losses are the Wizards (18) and Blazers (15), who have combined to have a 38-82 record. Of the 16 teams with the most blowout losses, ranging from six to 18, only four of those teams have a top-six seed in their respective conferences.
Overall/Takeaways
Overall, the "soft" metric created by RotoWire does a good job of reflecting team success. The 10 softest teams overall are the Pelicans, Wizards, Lakers, Raptors, Pacers, Hawks, Sixers, Blazers, Hornets and Bulls. Eight of those teams have a losing record and six have a winning percentage of .450 or lower. However, it's equally clear that opponent points per game allowed inside the paint and games lost by at least 20 points are the most influential, with technical fouls having minimal effect on team wins.