My first reaction after reading an article like I wrote last week is, "That was nice, but how does it help me win my fantasy league?". Well, leagues, plural, but you know what I mean. So, let's try to come up with some ways the exit velocity stuff can be applied in a practical manner.
The most actionable takeaway from the research is that average exit velocity on flyballs is a great leading indicator of home runs. As such, let's focus on that area to help frame 2022 rankings.
But first (you knew that was coming), let's think about exit velocity in a general sense. There are five factors contributing to how fast a struck ball comes off the bat:
- Bat speed
- Pitch speed
- Centering of contact
- Path swing trajectory versus pitch movement
- The ball's coefficient of restitution.
The first three are intuitively obvious. The fifth likely is as well. However, MLB using a bouncier ball in 2019 and then two different types this past season complicates comparing data sets. Plus, the effect of a humidor is altering the coefficient of restitution (bounciness) of the ball. In Colorado, moisture is added, reducing the bounciness. In a humid clime such as Miami, a humidor could have the reverse effect since it removes moisture from the horsehide, add springiness.
The fourth was discussed last week with respect to maximum exit velocity. Higher exit velocities occur when the swing path and the pitch movement are most closely aligned.
Much of the ensuing
My first reaction after reading an article like I wrote last week is, "That was nice, but how does it help me win my fantasy league?". Well, leagues, plural, but you know what I mean. So, let's try to come up with some ways the exit velocity stuff can be applied in a practical manner.
The most actionable takeaway from the research is that average exit velocity on flyballs is a great leading indicator of home runs. As such, let's focus on that area to help frame 2022 rankings.
But first (you knew that was coming), let's think about exit velocity in a general sense. There are five factors contributing to how fast a struck ball comes off the bat:
- Bat speed
- Pitch speed
- Centering of contact
- Path swing trajectory versus pitch movement
- The ball's coefficient of restitution.
The first three are intuitively obvious. The fifth likely is as well. However, MLB using a bouncier ball in 2019 and then two different types this past season complicates comparing data sets. Plus, the effect of a humidor is altering the coefficient of restitution (bounciness) of the ball. In Colorado, moisture is added, reducing the bounciness. In a humid clime such as Miami, a humidor could have the reverse effect since it removes moisture from the horsehide, add springiness.
The fourth was discussed last week with respect to maximum exit velocity. Higher exit velocities occur when the swing path and the pitch movement are most closely aligned.
Much of the ensuing analysis will entail examining differences in a player's exit velocity, be it over months or years. To draw a conclusion, it's necessary to ascertain the impetus of the change.
Sample size is always an issue. In a small sample, differences in exit velocity could be as simple as making contact on more fastballs than off-speed pitches for that time frame. This may have nothing to do with the player's skill and everything to do with how opposing pitchers are approaching the hitter, or even the type of hurlers the batter is facing over that stretch.
Similarly, it could be the type of pitches the batter is encountering in the small sample. If he's being fed a steady diet of pitches with downward movement (sinkers, changeups, splitters, curves), his exit velocity could be lower compared to those with less of a drop like a four-seam fastball, cutter, or slider. They are all moving downward, but a four-seamer doesn't drop as much as the brain expects while sharper, late movement drives the effectiveness of sliders and cutters.
Finally, the location of the pitches in a small sample can bias the exit velocity. It depends on the individual hitter's swing mechanics, but chances are they generate less bat speed on low or high pitches. Inside or outside can be telling as well. It happens fast, but the speed of a swing increases, then decreases. Obviously, maximum force is transferred at the apex of the bat speed. Contact on outside pitches likely occurs with less than maximum bat speed on that swing.
To be honest, none of this may manifest in the impending discussion, but it's good to get it out there for those wanting to do their own deep dives on players of interest.
I've elected to use 50 flyballs as the minimum sample to be included in each study as my research demonstrates it's sufficient to flesh out most of the biases.
A 50 flyball sample eliminates 2020 from the data set, as only four hitters qualify. Unfortunately, this means learning what the player did the previous season is off the table, at least "on paper". Depending on the question being considered, perhaps a smaller sample will still be trustworthy.
The other buzzkill is the different baseballs. As it happens, the flyball average exit velocity of qualified hitters in 2019 was 92.4 mph compared to 92.5 mph in 2021. After contact was made, differences in seam height influenced air resistance, hence travel distance, but the average exit velocities were essentially the same.
The bigger repercussion was the two distinct batches of balls MLB put into play last season. Reports suggest some teams may have played with a livelier ball more than others, potentially skewing results if the samples contain more of one ball than the other.
With that as a backdrop, here are the details of the study. As mentioned, only players with at least 50 flyballs for the season will be investigated. The plan is to identify batters fitting into one of these categories:
- Hitters whose power spike is supported
- Hitters due for power regression
- Potential breakout power hitters
The third category entails studying monthly trends. The problem is no one lofts 50 flies in a month, and very few do it in two months. As such, I decided to incorporate overlapping two-month periods with a minimum of 20 flyballs per segment. Admittedly, months are an arbitrary endpoint, but the purpose in identifying trends is to find a starting point to dig deeper. To employ a phrase on the verge of being cliché, the work will be descriptive, not predictive - though speculative verdicts will be presented.
Don't worry, we're almost ready for some player analysis. There is just one more item requiring an explanation. Expected home runs (xHR) will be part of the discussion. One will be directly pulled from Statcast, the other is an extrapolation based on flyball average exit velocity, heretofore referred to as FB AEV.
Statcast takes the specifications of each batted ball (exit velocity, launch angle, etc.) and compares it to the database of all similarly struck balls. Using 100 data points as an example, if the batted ball resulted in an out 50 percent of the time, a single five percent, double 20 percent, triple five percent and a home run 20 percent, the batter would be credited with .5 hits, .05 singles, .2 doubles, .05 triples and .20 homers. This calculation is carried out for each batted ball, resulting in an expected stat line. The caveat is the expected outcomes are not park corrected. The above expectations could have been an outfield line drive. Half the time, it is caught. In Fenway Park, it hits the wall for a single. In Coors Field, it lands on the grass and skips to the wall for a triple. The point is, sometimes xHR is misleading, especially in quirky venues. A flyball could land in the Crawford Boxes in Minute Maid Park but be an out almost everywhere else. Same as a flyball into the short porch in Yankee Stadium. A flyball could be tracked down in big parks but become a souvenir in others. This needs to be kept in mind whenever using Statcast data in next level analysis.
Home runs based on FB AEV assume a linear relationship between FB AEV and HR/FB. The expected HR/FB based on the FB AEV is computed, with xHR dependent on the number of flyballs (xHR = xHR/FB x #FB). This works well as an estimator, though the linearity lessens at the extremes.
With that, it's finally time for some names!
Perez's 98.1 mph FB AEV was seventh among qualifies batters and didn't vacillate much month to month. His Statcast xHR is 51, three more than the actual 48. FB AEV xHR pegs him at 45 but is likely underselling Perez, since his FB AEV was extremely high. The takeaway is his homers were fully supported the underlying skills. The question is whether Perez will carry this level over to 2022?
Year | No. Flyballs | AEV | Launch Angle | Ave FB Distance |
|---|---|---|---|---|
2017 | 117 | 92 | 35.9 | 324.8 |
2018 | 126 | 93.4 | 37.3 | 326.2 |
2020 | 30 | 94.5 | 35.9 | 340.8 |
2021 | 150 | 98.1 | 38.7 | 338.2 |
Perez missed all of 2019 recovering from Tommy John surgery. His FB AEV has been on the rise, but 2021's spike was quite steep. The increase in launch angle indicates more of an uppercut swing. Perhaps this is the root cause for the FB AEV jump, but Perez also hit grounders with more force, suggesting his bat speed improved. Maybe being out in 2019 and playing a short season in 2020 left Perez fresher than previous campaigns. If so, after a full 2021 season, will he maintain the new bat speed in 2022?
Clearly, it's speculation. Chances are, Perez will lose some bat speed. From a theoretical perspective, there is no way to quantify the level, other than to peg it somewhere between 2018 and 2021, tilting towards last season. Practically speaking, Perez will be the first catcher drafted in most leagues, so it's less about the number of projected homers and more about when the 'early catcher' team decides to take the plunge.
VERDICT: Power surge is real, but will likely fall back a bit
Polanco's FB AEV was only 93.0 mph, just a tick above league average. His previous high was 91.5 in 2019, the happy fun ball season. Otherwise, it's been 87-88. Clearly, last season was an increase, but was it enough to support 33 homers? Statcast xHR is close at 31.4, but his FB AEV is well under at 23.9 xHR.
Polanco posted a 45 percent FB%, which is just three points above his career mark. So sure, it was above normal, but it wasn't a new level, but rather at the high end of an expected range.
VERDICT: Significant drop (mid-20s) likely, which is contrary to those trusting Statcast and other types of xHR. HR/FB likely to slide, as is FB%.
Belt's FB AEV from 2018-2020 was around 91.5 mph. In 2021, it spiked to 95.0, so his power surge was supported. The trick is deciding if he'll maintain the gain. He's always been a flyball hitter, implying he employs an uppercut stroke. Belt's groundball AEV has always had one of the bigger deltas from his FB AEV, but it expanded even more last season:
Year | GB AEV | FB AEV | Diff |
|---|---|---|---|
2018 | 82.1 | 91.5 | 9.4 |
2019 | 82.7 | 91.7 | 9 |
2020 | 83.3 | 91.2 | 7.9 |
2021 | 79.3 | 95 | 15.7 |
The league average difference between FB AEV and GB AEV is 5.6 mph, so Belt is extreme. He hit a career high 50 percent flyballs, so it appears even more uppercut was added to his swing, explaining the drop in GB AEV since the difference between the swing plane and the trajectory of the pitch was more exaggerated.
VERDICT: The HR surge was real, and if Belt maintains the approach, the power will persist, especially since altered wind currents at Oracle Park have aided right field pop. Health and the threat of a platoon are both concerns, but the likely discount should easily justify investing.
Wisdom was recalled early in the first half to replace the injured Matt Duffy. His playing time dwindled when everyone was healthy but picked up when the club traded Anthony Rizzo and Kris Bryant. Strikeouts are always going to be an issue for Wisdom, but with a lower league batting average, a player with his profile can still be useful if the power can be trusted.
Based on FB AEV, there was nothing fluky about last season's outburst. It may be a little concerning his FB AEV was 99.2 mph in May and June but dropped to 96.3 in August and September, but 96.3 mph is still well above average and should portend ample long balls.
Wisdom hit only 10 combined flyballs in his short MLB stints from 2018-2020, so that tells us nothing. He mashed 31 homers for Triple-A Memphis in 2017 and the same number at Triple-A Nashville in 2019, but in both cases, he was advanced for the level (25 years old in 2017). Obviously, we don't have FB AEV from those seasons.
VERDICT: It's speculative, but 96-99 mph is so far over league average it didn't come about by accident. Wisdom should be able approach or repeat last season, which isn't necessarily a good thing, unless you can buffer his average. Though, he has to fan less than 41 percent of the time, right?
Muncy has always sported an above average FB AEV, but last season was extreme at 97.2 mph, tied for 16th highest among qualified hitters. The fact he was coming off such a poor pandemic season makes it even more compelling. Not to mention, Muncy's average flyball distance portended 39 homers, compared to the actual 36 he hit out of the yard.
In cases like this, there are likely two causes for the bump in FB AEV. The batter hits everything harder or he adds loft to his swing, and GB AEV suffers.
Year | FB AEV | GB AEV | Difference | Overall AEV |
|---|---|---|---|---|
2018 | 96.4 | 85.1 | 11.3 | 90.8 |
2019 | 94.7 | 84.7 | 10 | 90 |
2020 | 93.8 | 81.9 | 11.9 | 88.5 |
2021 | 97.2 | 83.6 | 13.6 | 91.2 |
Or maybe it's a little of both.
VERDICT: Admittedly, not the most exciting conclusion, but 2020 is the outlier and if Muncy maintains last season's AEV gains, he has 40-HR upside, based on being a smidge unlucky last season.
O'Neill caught my eye with third highest FB AEV last year. His 98.9 MPH was only eclipsed by Shohei Ohtani (99.6) and, wait for it… Mike Zunino (100.3).
It was also good to see O'Neill carry over some of his contact gains from the abbreviated 2020 campaign, though last year's 31.3 percent K% is still generous.
This brings up a good point not mentioned yet. Based on the delta between O'Neill's FB and GB AEV, he has an uppercut swing. One of the repercussions of this path is that the bat is in the hitting zone for less time than a flatter cut, reducing the chance for contact. It's a Catch-22. The uppercut transfers more force to the ball, but it also lessens the potential for contact. For someone like O'Neill, hoping for fewer strikeouts could do more harm than good. OK, the 35-40 percent he displayed when he first came up is extreme, but hoping for another five percent reduction could entail him changing his swing mechanics, with undesired ancillary effects.
I was assigned O'Neill's site outlook, in which it was noted much of his contact improvement came on breaking pitches, suggesting his recognition of curves and sliders got better.
VERDICT: O'Neill has always hit the ball hard. His home run output is capped playing in Busch Stadium, but his FB AEV is sufficient to continue hitting bountiful homers. The improved pitch recognition is very encouraging and bodes well for maintaining a lower (but still high) K%. This avails a buying opportunity for those expecting regression from 2021. It may manifest, but with a very soft landing.
Laureano is known for his highlight-reel catches and jaw-dropping throws. He stroked 24 homers in 2019, but many wrote it off to the superball deployed that season. While Laureano isn't among the top FB AEV, he's been above average, so there is more to 2019's pop than the bouncy ball. That said, his home park suppresses power, as do many of the other AL West venues.
VERDICT: It's a mistake to dismiss Laureano's HR potential and draft him solely "for some cheap speed". In early drafts, there is a bit of "out of sight, out of mind" occurring after he missed much of last season with his suspension which will carry over to the impending campaign, but if you can afford a month-long stash, Laureano has some latent pop.
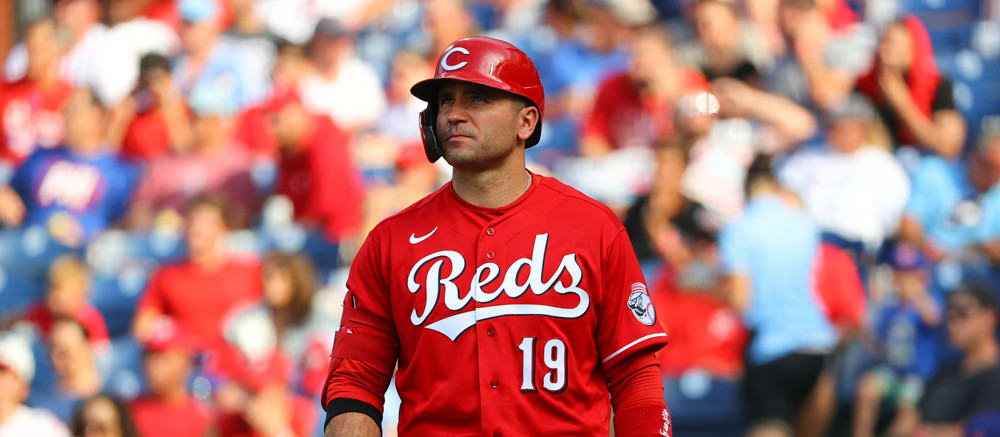
A common narrative is that when Votto was hurt last season, he decided to forego the patient approach and let it fly when he came back, and if it wasn't for the white-hot streak just after the break, the results wouldn't have been impressive.
Well, aside from the fact you can't categorically ignore what happened during that spell, monthly FB AEV splits demonstrate Votto was hitting the ball harder before he got hurt, but he wasn't getting the commensurate results with only five homers in 29 games (118 plate appearances).
Year | FB AEV | Overall AEV | K% | BB% | O-Swing% | Z-Swing% | Swing% |
|---|---|---|---|---|---|---|---|
2018 | 92.3 | 88.4 | 16.2% | 17.3% | 12.4% | 64.4% | 39.7% |
2019 | 90.4 | 89.1 | 20.2% | 12.5% | 19.2% | 63.6% | 41.1% |
2020 | 90.8 | 87.4 | 19.3% | 16.6% | 16.6% | 56.9% | 36.2% |
2021 | 97.6 | 92.9 | 23.8% | 14.4% | 23.1% | 64.7% | 43.9% |
It's clear Votto not only swung harder, but he expanded his approach to make contact outside the zone. It didn't really cost him in walks, though Votto did fan at a career-high rate.
VERDICT: If Votto had changed his approach at 27 years old and not 37, who knows what might have happened. However, why would he revert in his age-38 campaign? This version is intriguing, and well worth the investment. The main concern is the quality of batters around Votto for him to knock in.
Oops, I did it again. We're running long, so let's call it a day. Next week, more batters will be discussed in this manner. In the meantime, like always, feel free to hit me up with question in the comments below.


