MLB Predictions: Peter Schoenke's MLB Win Totals 2024
Before each baseball season the last 23 years I've written a story at RotoWire with my best bets for the season-long win totals. I'm a big fan of the season win total bets ever since I started making them in person in Las Vegas back in the late 1990s. I've used several concepts of sabrermetrical analysis to try to find teams that appeared to be good historical bets.
Last year was my worst year writing the column. I picked the under on the Orioles and Diamondbacks only to see those bets fail spectacularly. The Orioles won over 100 games. I made a large bet they'd win less than 76.5. I bet Arizona would win fewer than 75.5 games. Instead, they made it to the World Series. So, I debated ending this column.
My track record lately has waned. And the early South Korea start didn't fit with my schedule. But after 23 years, I can't give up. And looking back at last year, I think my analysis on both teams still had merit. So while this is late, here is my take on the 2024 season from a wagering perspective.
Despite my recent struggles, I still have a decent track record, winning 59 of 110 (with one push) bets for a 53.6 percent win rate. My best bet each season is 19-17 (I had multiple biggest bets some years). I'm a little better on bets of $100 or more (I vary my bet size to emphasize how strongly I feel about the pick) where I'm 14-12 (53.8 percent). I'm most impressive when looking at the total amount bet, where I've been correct 56.1 percent of the time ($3,550 in winning bets, $2,775 in losers - not factoring in the vig*).
For this exercise, I'm using MLB odds from Fanduel Sportsbook on March 26.
Baseball fans in NC can now take advantage of the FanDuel North Carolina promo code with online sports betting having launched in the Tar Heel State ahead of Opening Day.
Here's my take on each team with more analysis below on those I selected as my "bets."
| Team | 2024 O/U | My Pick |
|---|---|---|
| Arizona Diamondbacks | 84.5 | under |
| Atlanta Braves | 101.5 | under |
| Baltimore Orioles | 89.5 | over |
| Boston Red Sox | 77.5 | under |
| Chicago Cubs | 83.5 | over |
| Chicago White Sox | 61.5 | over |
| Cincinnati Reds | 81.5 | under |
| Cleveland Indians | 79.5 | over |
| Colorado Rockies | 59.5 | under |
| Detroit Tigers | 80.5 | under |
| Houston Astros | 93.5 | under |
| Kansas City Royals | 73.5 | under |
| Los Angeles Angels | 72.5 | under |
| Los Angeles Dodgers | 102.5 | under |
| Miami Marlins | 77.5 | under |
| Milwaukee Brewers | 77.5 | over |
| Minnesota Twins | 86.5 | over |
| New York Mets | 80.5 | under |
| New York Yankees | 90.5 | under |
| Oakland Athletics | 58.5 | under |
| Philadelphia Phillies | 89.5 | over |
| Pittsburgh Pirates | 75.5 | over |
| San Diego Padres | 83.5 | over |
| San Francisco Giants | 83.5 | under |
| Seattle Mariners | 87.5 | over |
| St. Louis Cardinals | 84.5 | under |
| Tampa Bay Rays | 85.5 | over |
| Texas Rangers | 88.5 | under |
| Toronto Blue Jays | 86.5 | over |
| Washington Nationals | 66.5 | over |
When I look at an upcoming baseball season, there are eight methods I use to judge which teams might be a good bet: Three are statistical, four are observations I've had watching the bookies set season-long lines for MLB and other sports and lately I've thrown in a wild-card pick with no particular theoretical basis. Here's the breakdown on these theories and the teams I decided to actually wager on.
The Johnson Effect
The Johnson Effect argues that a team that scores more runs or allows fewer runs than most statistical formulas would suggest, is bound to regress the next season. For example, if one team scores more runs than sabermetric formulas such as Runs Created or OPS might suggest, then it will score less the next season.
The theory works based on the fact that sometimes a team has more success than it should just based on pure luck. A bad bounce here, a fluke play here - they can add up in one season and make a team look more powerful than it should be.
My favorite type of statistic for this analysis is a tool called the Pythagorean Theory. You probably learned the Pythagorean theory in trigonometry, but in baseball, it means that the ratio of a team's wins and losses will be similar to the relationship between the square of its runs scored and the square of its runs allowed.
If the runs a team scores and gives up in any given season don't translate into the expected win total from the Pythagorean Theory, that means something odd took place that should turn around next season.
Using the Johnson Effect and applying the Pythagorean Theory, who looks like they'll rebound in 2024? Here are the top teams that should have had more or less wins based on their 2023 runs allowed/created than they actually tallied:
| Team | Pythagorean Wins |
|---|---|
| Miami Marlins | +9 |
| Baltimore Orioles | +7 |
| Kansas City Royals | -8 |
| San Diego Padres | -10 |
I usually like to look for teams that have a differential of ten or more games. The Padres last year had a fluky season where they played worse than most of their leading indicators in part due to an unlucky bullpen (7th worst save percentage, but 11th in ERA). They may be worthy of a bet, but losing Juan Soto is a big loss. The sportsbooks have them improving 1.5 games. I'll pass.
The BetMGM North Carolina bonus code gets new customers a Bet $5, Get $150 bonus and is one of the top North Carolina betting promos available.
The Plexiglass Principle
This theory says that any team that improves dramatically in one season is likely to decline the next season.
What teams made such dramatic moves from 2022 to 2023?
| Team | Wins Improvement | |
|---|---|---|
| Texas Rangers | 22 | |
| Cincinnati Reds | 20 | |
| Baltimore Orioles | 18 | |
| Washington Nationals | 16 | |
| Miami Marlins | 15 | |
| Pittsburgh Pirates | 14 | |
| Detroit Tigers | 12 | |
| Arizona Diamondbacks | 10 | |
Since 1970, teams that have improved by 19 or more games declined by 7.35 wins the following season. The Reds have young exciting talent but suffered a number of injuries this spring. The sportsbooks have them about even (Fanduel's Mar. 27 line has them at 81.5 wins). I'd expect at least some decline. I'll bet $50 that the Reds don't win 81.5 games.
The Rangers, of course, won the World Series. Still, they only won 90 games. The Rangers also suffered some significant pitching losses for at least half a season. Jordan Montgomery left in free agency. Max Scherzer and Jacob deGrom won't be ready for months – if at all. The team has some young talent in Wyatt Langford and Evan Carter which could offset those losses. Still, there's probably a World Series hangover. I'll bet $25 that the Rangers don't win 88.5 games.
Stay up-to-date with the latest MLB betting developments here at RotoWire with everything from daily MLB picks and MLB odds to MLB futures and MLB player props.
The Reverse Plexiglas Principle
When a team has consistently been a winner and then experiences a sudden drop-off, there is a strong likelihood that its win total will rebound. Or at least that's my theory.
Here are the teams that declined the most in 2023:
| Team | Wins Decline |
|---|---|
| New York Mets | -26 |
| St. Louis Cardinals | -22 |
| Chicago White Sox | -20 |
| New York Yankees | -17 |
| Cleveland Indians | -16 |
| Houston Astros | -16 |
The Cardinals are the prime candidate of this group since the team's decline was unexpected and St. Louis spent a lot of money to give a floor to the rotation (Sonny Gray, Kyle Gibson, Lance Lynn). However, the sportsbooks have priced in a 13.5-game improvement. That's too rich for my tastes.
The Bottom Feeder Bet
Which teams are projected to have the lowest win totals?
| Team | Win Total | |
|---|---|---|
| Oakland Athletics | 58.5 | |
| Colorado Rockies | 59.5 | |
| Chicago White Sox | 61.5 | |
| Washington Nationals | 66.5 | |
The theory here is that sportsbooks really need to set the totals low to entice bets on unexciting teams. However, in the past 21 years, teams that the sportsbooks peg to win less than 64 games cover 67% of the time (8 of 12). It's a small sample but makes some sense.
Even so, it's just hard to make a case for either Colorado or Oakland. Both teams are just lost with few top prospects and no real plan (and Oakland even for a stadium). The White Sox may be the worst team in the league. Only the Nationals can I see improving, but their rotation may be the worst in the majors. I'll reluctantly pass.
The Book's Biggest Movers
The next thing I look at is what teams the bookies think will have the biggest improvement or decline this season.
| Team | Win Movement | |
|---|---|---|
| Kansas City Royals | +17.5 | |
| St. Louis Cardinals | +13.5 | |
| Baltimore Orioles | -11.5 | |
| Tampa Bay Rays | -14.5 | |
| Milwaukee Brewers | -15.5 | |
The Royals seem like an odd choice for the most improved team. Sure, Kansas City signed Michael Wacha and Seth Lugo to shore up the rotation. Cole Ragans could turn into an ace if he can stay healthy. Bobby Witt was signed to a mega extension, but he was already on the team last year. None of those moves say to me they're the most improved team in baseball. I'll bet $100 the Royals don't win 73.5 games.
The Rays amazingly slightly underperformed last season, at least to their 100 Pythagorean wins, while still becoming a playoff team. They have the usual losses (Tyler Glasnow to a trade, Wander Franco to off-field issues the biggest from start of last season) but have top prospects (Junior Caminero) and find pitchers to improve from other team's underperformers (Aaron Civale and Zack Littell, Ryan Pepiot). A bet on the Rays over just seems worthwhile as the sportsbooks (and everyone) always underestimates them. I'll bet $100 the Rays win more than 84.5 games.
The Book's Non Movers
What teams do the sportsbooks see standings still?
| Team | Win Movement |
|---|---|
| Cleveland Indians | +3.5 |
| Houston Astros | +3.5 |
| Los Angeles Dodgers | +3.5 |
| Detroit Tigers | +2.5 |
| San Diego Padres | +1.5 |
| Colorado Rockies | +0.5 |
| Cincinnati Reds | +0.5 |
| Chicago Cubs | +0.5 |
| Minnesota Twins | +0.5 |
| Chicago White Sox | -0.5 |
| Los Angeles Angels | -0.5 |
| Pittsburgh Pirates | -0.5 |
| Boston Red Sox | -0.5 |
| Arizona Diamondbacks | -0.5 |
| Seattle Mariners | -0.5 |
| Philadelphia Phillies | -0.5 |
| Texas Rangers | -1.5 |
| Toronto Blue Jays | -2.5 |
| Atlanta Braves | -2.5 |
The first thing that stands out is how many teams the sportsbooks will largely be unchanged from last season. The sportsbooks expect 19 teams to finish within 3.5 games of their 2023 win total. Compare that to 16 teams in 2023, 9 teams in 2022 and 7 teams in 2021 that the sportsbooks expected to be within 3.5 games of the prior year.
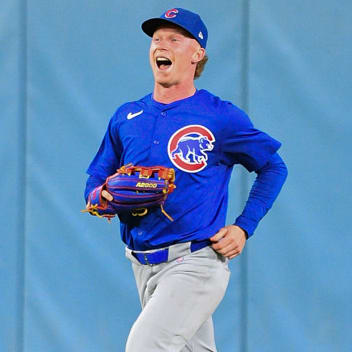
The two that stand out among this group are the Cubs and Red Sox. The Cubs have been at least signing free agents (Cody Bellinger, Shota Imanaga), paid big bucks to bring in perhaps the best manager in baseball (Craig Counsell) and are in a weak division. It seems like they'd be better. Meanwhile the Red Sox appear to be going the other direction with Lucas Giolito as their only big move of note – and he's out for the season after Tommy John surgery. I'll take $25 on the Cubs to win more than 83.5 games, and I'll take $25 for the Red Sox to win less than 77.5 games.
Wild Card
I've occasionally chosen a bet for this article that doesn't fit any statistical theory but rather is one trend I've followed. This year that theory would be on principle you should take the under on any team to win 100 games. But then the Dodgers have won over 100 in five of the last six full seasons. So maybe I'll pass.
MLB Win Total Best Bets for 2024 Recap
| Team | Bet | Theory |
| Tampa Bay Rays | $100 over 84.5 wins | Book Non-Mover |
| Texas Rangers | $25 under 88.5 wins | Plexiglas Principle |
| Cincinnati Reds | $50 under 81.5 wins | Plexiglas Principle |
| Kansas City Royals | $100 under 73.5 games | Book Mover |
| Chicago Cubs | $25 over 83.5 games | Book Non-Mover |
| Boston Red Sox | $25 under 77.5 games | Book Non-Mover |
*One note: My bets/track record doesn't account for the variations in extra juice you need to pay. Most lines are -110, meaning the sportsbook takes about five percent on each bet. The "vig" tends to be higher on these bets than for single games. Sometimes the vig can vary widely, such as when the 2016 Rangers' under of 83.5 wins was at -140 (the under was +110). It's another method for the bookmakers to alter how the money is coming in on each side so it gets to their comfort level. Or it's a way to change the odds without moving the win total.
If you are making a lot of bets, this is a serious factor in the math. But I don't bother to take that into account because I'm more focused on the overall wins number for a team perspective. Plus, I forgot to keep track of the vig in the early years.
I vary the dollar amounts below as a way to show how confident I am in the bet (the $300 bet on the 2004 Royals is my all-time high), so there are some holes in the math if you added in all the varying vigs.
And why should you care what I think? I've made money 12 of the last 22 years (with one push). Here's the breakdown:
| YEAR | W/L | TEAM | BET | THEORY |
|---|---|---|---|---|
| 2023 | Loss | Baltimore Orioles | $200 under 76.5 wins | Plexiglas Principle |
| 2023 | Loss | Arizona Diamondbacks | $50 under 75.5 wins | Plexiglas Principle |
| 2023 | Won | Tampa Bay Rays | $25 over 89.5 wins | Reverse Plexiglas |
| 2023 | Loss | Toronto Blue Jays | $25 over 91.5 wins | Book Non-Mover |
| 2022 | Won | Oakland | $25 under on 69.5 wins | Wild Card |
| 2022 | Lost | Tampa Bay | $100 over on 89.5 wins | Book Mover |
| 2022 | Lost | Baltimore | $25 under on 61.5 wins | Bottom Feeder |
| 2022 | Won | Boston | $25 under on 85.5 wins | Plexiglas Principle |
| 2022 | Lost | Seattle | $25 under on 83.5 wins | Plexiglas Principle |
| 2021 | Lost | Chicago White Sox | $50 under on 90.5 wins | Plexiglas Principle |
| 2021 | Lost | Washington Nationals | $25 over on 84.5 wins | Reverse Plexiglas Principle |
| 2021 | Won | Houston Astros | $25 over on 87.5 wins | Reverse Plexiglas Principle |
| 2021 | Lost | Detroit Tigers | $100 under on 68.5 wins | Bottom Feeder |
| 2021 | Won | Texas Rangers | $25 under on 66.5 games | Bottom Feeder |
| 2021 | Lost | Toronto Blue Jays | $25 under on 86.5 games | Book Non-Mover |
| 2021 | Lost | Minnesota Twins | $50 over on 88.5 wins | Book Mover |
| 2021 | Won | Tampa Bay Rays | $50 over on 85.5 wins | Book Mover |
| 2021 | Lost | Lost Angeles Dodgers | $25 under on 102.5 wins | Wild Card |
| 2020 | Lost | Chicago White Sox | $25 on less than 31.5 games | Book Mover |
| 2020 | Won | New York Yankees | $25 on less than 37.5 games | Wild Card |
| 2020 | Lost | Los Angeles Dodgers | $25 on less than 37.5 games | Wild Card |
| 2020 | Won | Tampa Bay Rays | $50 on more than 33.5 games | Wild Card |
| 2019 | Won | Kansas City Royals | $50 on less than 69.5 wins | Book Mover |
| 2019 | Lost | San Francisco Giants | $50 on less than 73 wins | Book Non Mover |
| 2019 | Lost | Texas Rangers | $25 on less than 70 games | Book Non Mover |
| 2019 | Won | Baltimore Orioles | $50 on less than 58.5 wins | Bottom Feeder |
| 2019 | Won | Washington Nationals | $25 more than 88.5 games | Reverse Plexiglas Principle |
| 2018 | Won | Arizona Diamondbacks | $100 to win fewer than 85 games | Plexiglas Principle |
| 2018 | Won | Detroit Tigers | $50 on less than 66.5 wins | Book's Non Movers |
| 2018 | Won | San Diego Padres | $25 on less than 72.5 games | Johnson Effect |
| 2017 | Won | Tampa Bay Rays | $50 win more than 78.5 games | Johnson Effect |
| 2017 | Lost | Pittsburgh Pirates | $100 win more than 82 games | Reverse Plexiglas |
| 2017 | Lost | Los Angeles Angels | $50 on less than 79 wins | Book's Non Movers |
| 2017 | Lost | Texas Rangers | $25 on win more than 84.5 games | Book's Biggest Movers |
| 2017 | Lost | Baltimore Orioles | $50 win more than 80 games | Wild Card |
| 2016 | Lost | Chicago Cubs | $25 win less than 93.5 games | Plexiglas Principle |
| 2016 | Lost | Milwaukee Brewers | $50 win less than 70 games | Bottom Feeder Bet |
| 2016 | Lost | New York Yankees | $25 win over than 85 games | Wild Card |
| 2015 | Lost | Houston Astros | $25 win less than 75.5 games | Plexiglas Principle |
| 2015 | Won | Los Angels Angels | $25 win less than 88.5 games | Plexiglas Principle |
| 2015 | Won | Texas Rangers | $25 win over than 76.5 games | Reverse Plexiglas Principle |
| 2015 | Lost | Boston Red Sox | $25 win over than 86.5 games | Reverse Plexiglas Principle |
| 2015 | Lost | Baltimore Orioles | $75 win over than 82.5 games | Book's Biggest Movers |
| 2015 | Won | Cincinnati Reds | $25 win less than 77.5 games | Book's Non Movers |
| 2015 | Won | Tampa Bay Rays | $50 win more than 78.5 games | Book's Non Movers |
| 2015 | Won | Oakland A's | $100 win more than 81.5 games | Billy Beane Theory |
| 2014 | Lost | Cleveland Indians | $25 win less than 82 games | Plexiglas Principle |
| 2014 | Won | Houston Astros | $25 more than 62.5 games | Bottom Feeder |
| 2014 | Won | Philadelphia Phillies | $50 under on 74.5 games | Book Non Mover |
| 2014 | Won | Oakland A's | $25 over on 86.5 games | Billy Beane Theory |
| 2014 | Lost | Tampa Bay Rays | $100 over on 89 games | Billy Beane Theory |
| 2013 | Won | Toronto Blue Jays | $50 under on 89 games | Book Mover |
| 2013 | Won | Oakland A's | $25 over on 84.5 games | Billy Beane Theory |
| 2013 | Won | Tampa Bay Rays | $50 over on 86.5 games | Billy Beane Theory |
| 2013 | Lost | Kansas City Royals | $50 under on 78.5 games | Billy Beane Theory |
| 2013 | Won | Baltimore Orioles | $25 over on 78.5 games | Wildcard |
| 2012 | Won | Arizona Diamondbacks | $200 under on 86 games | Plexiglas Principle |
| 2012 | Lost | Minnesota Twins | $100 over on 72.5 games | Reverse Plexiglas Principle |
| 2011 | Lost | Kansas City | $100 under on 68 games | Book Non Mover |
| 2011 | Won | Houston Astros | $50 under on 72 games | Johnson Effect |
| 2011 | Won | Milwaukee Brewers | $25 over on 86.5 games | Book Mover |
| 2011 | Lost | Los Angeles Angels | $50 under on 82.5 games | Wild Card |
| 2010 | Lost | Houston Astros | $150 under on 75.5 games | Johnson Effect & Book Non Mover |
| 2010 | Won | Minnesota Twins | $100 over on 82.5 games | Wildcard |
| 2010 | Won | Washington Nationals | $50 under on 72 games | Book Mover |
| 2009 | Lost | Los Angeles Angels | $50 under on 88.5 wins | Johnson Effect & Plexiglas Principle |
| 2009 | Won | Detroit Tigers | $50 over on 81.5 wins | Reverse Plexiglas |
| 2009 | Lost | Baltimore Orioles | $50 over on 72.5 wins | Bottom Feeder |
| 2009 | Lost | Kansas City Royals | $25 over on 76.5 wins | Book Non Mover |
| 2009 | Lost | Philadelphia Phillies | $50 under on 88.5 wins | Book Non Mover |
| 2009 | Lost | Oakland A's | $25 over on 82.5 wins | Billy Beane Theory |
| 2008 | Won | Seattle Mariners | $200 under on 84 wins | Johnson Effect |
| 2008 | Lost | Chicago Cubs | $50 under on 87.5 wins | Plexiglas Principle |
| 2008 | Won | Oakland A's | $50 over on 73.5 wins | Reverse Plexiglas Principle |
| 2008 | Push | San Francisco | $50 under on 72 wins | Book Non Mover |
| 2007 | Won | Cleveland Indians | $50 over on 85.5 wins | Johnson Effect |
| 2007 | Lost | Chicago Cubs | $50 under on 83.5 wins | Book Mover |
| 2007 | Lost | Oakland A's | $50 over on 85.5 wins | Book Mover |
| 2007 | Lost | Minnesota Twins | $100 over on 84 wins | Book Mover |
| 2007 | Won | Arizona Diamondbacks | $100 over on 78.5 wins | Book Non Mover |
| 2006 | Won | Chicago White Sox | $100 under on 92 wins | Johnson Effect & Plexiglas Principle |
| 2006 | Lost | Arizona Diamondbacks | $25 under on 73 wins | Johnson Effect & Plexiglas Principle |
| 2006 | Lost | Tampa Bay Devil Rays | $100 over on 68 wins | Bottom Feeder |
| 2006 | Lost | Milwaukee Brewers | $50 over on 81 wins | Book Non Mover |
| 2006 | Won | Minnesota Twins | $50 over on 83 wins | Book Non Mover |
| 2005 | Won | New York Yankees | $150 under on 102 wins | Johnson Effect |
| 2005 | Won | Milwaukee Brewers | $50 over on 69.5 wins | Bottom Feeder |
| 2005 | Won | San Diego Padres | $25 under on 86.5 wins | Plexiglas Principle |
| 2005 | Lost | Minnesota Twins | $25 over on 89.5 wins | Book Non Mover |
| 2004 | Won | Kansas City Royals | $300 under on 81 wins | Plexiglas Principle |
| 2004 | Won | Houston Astros | $50 over on 91 wins | Johnson Effect |
| 2004 | Lost | Detroit Tigers | $100 under on 66.5 wins | Book Mover |
| 2004 | Won | San Francisco Giants | $50 over on 85 wins | Book Mover |
| 2004 | Won | Florida Marlins | $50 over on 83 wins | Book Mover |
| 2003 | Won | Anaheim Angels | $100 under on 91 wins | Plexiglas Principle |
| 2003 | Won | Oakland A's | $50 over on 93.5 wins | Book Mover |
| 2003 | Won | New York Mets | $50 under on 86 wins | Book Mover |
| 2003 | Won | Toronto Blue Jays | $50 over on 79 wins | Book Non Mover |
| 2003 | Won | Boston Red Sox | $50 over on 91 wins | Johnson Effect |
| 2002 | Won | Oakland A's | $200 over on 90.5 wins | Book Mover |
| 2002 | Won | Philadelphia Phillies | $100 under on 82.5 wins | Plexiglas Principle |
| 2002 | Won | Pittsburgh Pirates | $50 over on 68 wins | Bottom Feeder |
| 2002 | Lost | Seattle Mariners | $50 over on 94 wins | Reverse Plexiglas Principle |
| 2002 | Lost | Colorado Rockies | $50 over on 77 wins | Johnson Effect |
| 2002 | Lost | New York Yankees | $50 under on 99 wins | Reverse Bottom Feeder |
| 2001 | Lost | St. Louis Cardinals | $100 under on 89.5 wins | Plexiglas Principle |
| 2001 | Won | Chicago White Sox | $100 under on 88 wins | Plexiglas Principle |
| 2001 | Won | Houston Astros | $100 over on 82.5 wins | Johnson Effect & Plexiglas Principle |
| 2001 | Won | Philadelphia Phillies | $25 over on 74.5 wins | Bottom Feeder & Johnson Effect |
| 2001 | Won | Minnesota Twins | $25 over on 73 wins | Bottom Feeder |
| 2000 | Won | Arizona Diamondbacks | $100 under on 93 wins | Plexiglas Principle |
| 2000 | Won | Minnesota Twins | $100 over on 64 wins | Bottom Feeder |


