The newest hot stat I keep hearing about is Pulled Air Rate (Pulled Air%), which is available on a Baseball Savant leaderboard. It's a simple concept. The more often a hitter pulls the ball in the air, the odds increase that the ball scrapes over the wall for a home run. I'm going to do a little background on the stat, and then look at a couple of leaderboards.
Isaac Paredes pulls flyballs like there is no tomorrow to get his home runs. Here is his spray chart from last season:
Not one home run to center or right field. He takes advantage of the shorter distance.
All hitters are making a conscious change to pull more balls, and it can be seen in the league-wide Pulled Air%:
Year | Pulled Air% |
|---|---|
2015 | 14.9% |
2016 | 15.7% |
2017 | 16.1% |
2018 | 16.4% |
2019 | 16.9% |
2020 | 16.9% |
2021 | 16.8% |
2022 | 17.1% |
2023 | 17.6% |
2024 | 17.8% |
2025 | 18.2% |
The upward trend has been slow but steady.
Next, I wanted to find out how sticky a hitter's Pulled Air% is from season to season. The correlation is quite high, with the value stabilizing around 340 batted-ball events. (149 batters met that total in 2025.) At that point, the batter should expect their future Pulled Air% to be based on 50 percent of their total and 50 percent of the league average.
So to start with, here are the hitters with at least 340 balls in play who had the highest Pulled Air%:
| Name | BBE | Pull |
|---|
The newest hot stat I keep hearing about is Pulled Air Rate (Pulled Air%), which is available on a Baseball Savant leaderboard. It's a simple concept. The more often a hitter pulls the ball in the air, the odds increase that the ball scrapes over the wall for a home run. I'm going to do a little background on the stat, and then look at a couple of leaderboards.
Isaac Paredes pulls flyballs like there is no tomorrow to get his home runs. Here is his spray chart from last season:
Not one home run to center or right field. He takes advantage of the shorter distance.
All hitters are making a conscious change to pull more balls, and it can be seen in the league-wide Pulled Air%:
Year | Pulled Air% |
|---|---|
2015 | 14.9% |
2016 | 15.7% |
2017 | 16.1% |
2018 | 16.4% |
2019 | 16.9% |
2020 | 16.9% |
2021 | 16.8% |
2022 | 17.1% |
2023 | 17.6% |
2024 | 17.8% |
2025 | 18.2% |
The upward trend has been slow but steady.
Next, I wanted to find out how sticky a hitter's Pulled Air% is from season to season. The correlation is quite high, with the value stabilizing around 340 batted-ball events. (149 batters met that total in 2025.) At that point, the batter should expect their future Pulled Air% to be based on 50 percent of their total and 50 percent of the league average.
So to start with, here are the hitters with at least 340 balls in play who had the highest Pulled Air%:
| Name | BBE | Pull Air% |
|---|---|---|
| Cal Raleigh | 411 | 38.4% |
| Spencer Torkelson | 399 | 31.8% |
| Kyle Schwarber | 408 | 31.1% |
| Jose Ramirez | 525 | 30.9% |
| Pete Crow-Armstrong | 454 | 30.2% |
| Eugenio Suarez | 399 | 28.6% |
| Ozzie Albies | 514 | 27.2% |
| Jeff McNeil | 350 | 26.9% |
| Salvador Perez | 473 | 26.6% |
| Andrew Benintendi | 344 | 26.5% |
| Byron Buxton | 346 | 26.0% |
| Spencer Steer | 383 | 25.8% |
| Angel Martinez | 345 | 25.5% |
| Hunter Goodman | 390 | 25.4% |
| Jose Altuve | 486 | 25.3% |
| Mike Yastrzemski | 376 | 25.3% |
| Ben Rice | 369 | 25.2% |
| Jorge Polanco | 397 | 25.2% |
| Vinnie Pasquantino | 519 | 25.0% |
| Nolan Arenado | 356 | 25.0% |
| Kyle Tucker | 416 | 24.8% |
| Cody Bellinger | 507 | 24.7% |
| Alex Bregman | 365 | 24.4% |
| Seiya Suzuki | 415 | 24.3% |
| Wyatt Langford | 343 | 24.2% |
That's a lot of good hitters. Here are my thoughts on some of the more interesting names.
Angel Martinez: He stands out on the "one of these guys isn't like the others" front, especially since he's a switch hitter. While Martinez pulled his flyballs, most of them didn't leave the park since his StatCast power metrics are in the 10th percentile or lower.
Another issue with Martinez is that he can only hit lefties. Over two seasons, he has a .563 OPS against right-handed pitchers and a .775 OPS against lefties.
Hunter Goodman: Goodman's breakout season (31 homers, .278 average) occurred while he pulled 21 home runs. Since he should continue to pull the ball, I'd feel good about a repeat season in 2026.
Mike Yastrzemski: The poor guy has been in home run purgatory (i.e., San Francisco) for his entire career. He finally gets traded, and it's to another monstrous home park in Kansas City. He is now a free agent, and just about any team's home park would be an improvement. The only knock on him is that he'll likely be on the strong side of a platoon, thereby limiting his plate appearances.
Ben Rice: When it comes to draft day, there will be some sticker shock on Ben Rice, and even then, he might be undervalued. Just about every batted ball metric points to him being one of the league's unluckiest hitters (e.g., .358 wOBA, .410 xwOBA).
He is slotted in to play first base and catcher, so he'll get tons of plate appearances for someone who's catcher-eligible.
Jorge Polanco: I think Polanco is finally healthy after years of missing time and needing a couple of surgeries. He hasn't been on the injured list since June of 2024, and he's only sat twice for minor injuries while batting .251/.316/.457 with 37 home runs since then (tied for 45th over that span).
Here are the Pulled Air% leaders with a minimum of 50 BBE. A few more possible sleepers can be found on this list.
| Name | BBE | Pull Air% |
|---|---|---|
| Isaac Paredes | 304 | 38.5% |
| Michael Helman | 81 | 38.3% |
| Rhys Hoskins | 194 | 34.5% |
| Davis Schneider | 129 | 33.3% |
| Danny Jansen | 205 | 32.7% |
| Max Muncy | 235 | 31.5% |
| Anthony Santander | 134 | 31.3% |
| Cedric Mullins | 324 | 29.6% |
| Jake Fraley | 142 | 29.6% |
| Daulton Varsho | 176 | 29.5% |
| David Fry | 88 | 29.5% |
| Jesse Winker | 51 | 29.4% |
| Dalton Rushing | 86 | 29.1% |
| Matt Wallner | 224 | 29.0% |
| Miguel Amaya | 76 | 28.9% |
| Austin Hedges | 118 | 28.8% |
| Matt Mervis | 71 | 28.2% |
| Cavan Biggio | 50 | 28.0% |
| Alex Freeland | 50 | 28.0% |
| Kerry Carpenter | 329 | 28.0% |
| Tristan Gray | 61 | 27.9% |
| Gary Sanchez | 65 | 27.7% |
| Andruw Monasterio | 94 | 27.7% |
| Christopher Morel | 169 | 27.2% |
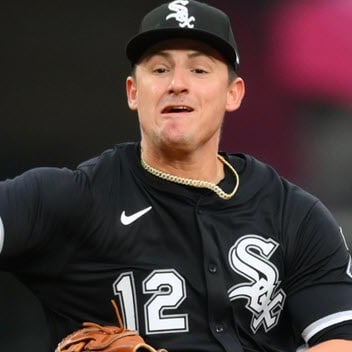
| Colson Montgomery | 173 | 27.2% |
Isaac Paredes: Right at the top like every year. He didn't make the first list because of the time he spent on the IL.
Michael Helman: From the end of August on, Helman started in center field for the Rangers. A .247 BABIP limited his rate stats, but the 29-year-old was still able to hit five homers and steal four bases. A deep sleeper if he's able to keep his job.
Rhys Hoskins: For Hoskins to have any fantasy value, the free agent will need a full-time job and some good health. Starting in 2021, he's accumulated over 520 plate appearances just once, and he managed just 324 last season.
Davis Schneider: I wish Schneider would get traded so he'd have a full-time role. There are just too many part-time bats in Toronto. While he's a batting average drain, he could hit 30 homers with 10 steals. Additionally, he's qualified at second base and in the outfield.
Daulton Varsho and Anthony Santander: These two sluggers are part of the reason Schneider won't have a set role. Both dealt with injuries in 2025. They both showed high Pulled Air% in 2024, with Varsho having the eighth highest value and Santander the 12th. Both should be cheap power sources.
Andruw Monasterio: The 28-year-old had a mini breakout last year, batting .270/.319/.437 with 4 HR in 135 PA. He never got a full run with the Brewers while playing all over the field (all four infield spots and some outfield). He doubled his Pulled Air% from 14 percent to 28 percent, leading to major jumps in his slugging percentage (.272 to .437) and ISO (.064 to .167). If he happens to find his way into everyday at-bats, he has 20-homer, 10-steal upside.
Colson Montgomery: Montgomery's going to get a ton of love after hitting 21 homers in 284 plate appearances last season. He comes with two concerns. The first is whether he can keep up the Pulled Air%. Heavy regression should be expected. The second is his 29 percent strikeout rate (and 33 percent strikeout rate and Triple-A) since he struggles against secondary pitches.


