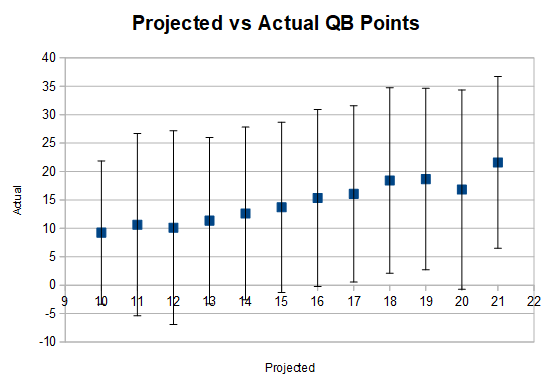
First off, a little note on projections. They can vary greatly and owners should have an idea on the variation between projections and the results. For instance, here are the actual quarterback results (95 percent range) grouped by rounded projected results (a bit lower because of injured quarterbacks).

I'm not sure what the most important takeaway is from the data but several pieces are important. First, my projection's range of possible outcomes (at the 95 percent level) is +/- 15 points. A quarterback projected for 15 points is most like to produce somewhere between zero and 30 points. At that range, 100 percent guesswork may be an option for most owners. Hopefully, I can improve these results.
Second, after comparing my values to the standard RotoWire projections, the range of outputs for my values is within the industry norm. With most other projections likely having a similar outcome range, I can see why creators don't brag up their results. Their projections could be the best in the industry, but they're still not acceptably accurate.
Third, and most important, owners might not want to know the inherent risk of each player. They just want to go with their best team and not know their results mostly tied to inherent variation.
With the
First off, a little note on projections. They can vary greatly and owners should have an idea on the variation between projections and the results. For instance, here are the actual quarterback results (95 percent range) grouped by rounded projected results (a bit lower because of injured quarterbacks).

I'm not sure what the most important takeaway is from the data but several pieces are important. First, my projection's range of possible outcomes (at the 95 percent level) is +/- 15 points. A quarterback projected for 15 points is most like to produce somewhere between zero and 30 points. At that range, 100 percent guesswork may be an option for most owners. Hopefully, I can improve these results.
Second, after comparing my values to the standard RotoWire projections, the range of outputs for my values is within the industry norm. With most other projections likely having a similar outcome range, I can see why creators don't brag up their results. Their projections could be the best in the industry, but they're still not acceptably accurate.
Third, and most important, owners might not want to know the inherent risk of each player. They just want to go with their best team and not know their results mostly tied to inherent variation.
With the range of results known, here are the results from last week.
| PLAYER | PASS ATT | SPREAD | HYBRID | ROTOWIRE | AVG | DIFF | ACTUAL | HYBRID DIFF | ROTOWIRE DIFF | AVG DIFF |
| Aaron Rodgers | 20.3 | 18.7 | 20.3 | 20.1 | 14.6 | 0.2 | 24.8 | 4.5 | 4.7 | 10.2 |
| Alex Smith | 17.2 | 18.7 | 17.2 | 13.6 | 14.6 | 3.7 | 15.1 | 2.1 | 1.5 | 0.5 |
| Andy Dalton | 17.5 | 16.7 | 17.5 | 12.8 | 14.6 | 4.7 | 16.3 | 1.2 | 3.5 | 1.7 |
| Ben Roethlisberger | 16.5 | 16.1 | 16.5 | 14.8 | 14.6 | 1.8 | 12 | 4.5 | 2.8 | 2.6 |
| Blake Bortles | 17.5 | 15.1 | 17.5 | 10.7 | 14.6 | 6.7 | 27.6 | 10.1 | 16.9 | 13 |
| Brian Hoyer | 15 | 15.1 | 15 | 9.7 | 14.6 | 5.3 | 26.2 | 11.2 | 16.5 | 11.6 |
| Cam Newton | 18.5 | 19.2 | 18.5 | 16.9 | 14.6 | 1.6 | 8.3 | 10.2 | 8.6 | 6.3 |
| Carson Palmer | 17 | 15.5 | 17 | 12.4 | 14.6 | 4.6 | 17.7 | 0.7 | 5.3 | 3.1 |
| Carson Wentz | 16.4 | 15 | 16.4 | 14.5 | 14.6 | 1.9 | 13.2 | 3.2 | 1.3 | 1.4 |
| Case Keenum | 8.5 | |||||||||
| Dak Prescott | 15.9 | 18.4 | 15.9 | 15.1 | 14.6 | 0.8 | 16.7 | 0.8 | 1.6 | 2.1 |
| Derek Carr | 16.8 | 17.4 | 16.8 | 15.4 | 14.6 | 1.5 | 5.2 | 11.6 | 10.2 | 9.4 |
| Deshaun Watson | 12.1 | 12.1 | 9.5 | 14.6 | 2.6 | 20.1 | 8 | 10.6 | 5.5 | |
| DeShone Kizer | 12.2 | 12.2 | 8 | 14.6 | 4.1 | 22.1 | 9.9 | 14.1 | 7.5 | |
| Drew Brees | 18.9 | 16.2 | 18.9 | 16.4 | 14.6 | 2.5 | 20.8 | 1.9 | 4.4 | 6.2 |
| Eli Manning | 16.1 | 14.4 | 16.1 | 11.8 | 14.6 | 4.3 | 22.6 | 6.5 | 10.8 | 8 |
| Jacoby Brissett | 10.9 | 16.9 | 10.9 | 9.2 | 14.6 | 1.7 | 27.8 | 16.9 | 18.6 | 13.2 |
| Jameis Winston | 13.5 | |||||||||
| Jared Goff | 12.8 | 14.2 | 12.8 | 12.4 | 14.6 | 0.4 | 23.6 | 10.8 | 11.2 | 9 |
| Jay Cutler | 14.2 | 16.7 | 14.2 | 14.1 | 14.6 | 0 | 11.7 | 2.5 | 2.4 | 2.9 |
| Joe Flacco | 17.5 | 14.5 | 17.5 | 10.9 | 14.6 | 6.6 | -2.9 | 20.4 | 13.8 | 17.5 |
| Josh McCown | 14.9 | 14.9 | 14.9 | 7.5 | 14.6 | 7.3 | 14.7 | 0.2 | 7.2 | 0.1 |
| Kirk Cousins | 18.3 | 18.4 | 18.3 | 14.7 | 14.6 | 3.6 | 26.8 | 8.5 | 12.1 | 12.2 |
| Marcus Mariota | 16 | 17.8 | 16 | 13.8 | 14.6 | 2.2 | 19.7 | 3.7 | 5.9 | 5.1 |
| Matt Ryan | 17.7 | 19.4 | 17.7 | 17 | 14.6 | 0.7 | 13.7 | 4 | 3.3 | 0.9 |
| Matthew Stafford | 17.6 | 17.6 | 17.6 | 15.5 | 14.6 | 2.1 | 16.5 | 1.1 | 1 | 1.9 |
| Mike Glennon | 7.8 | 16 | 7.8 | 9.3 | 14.6 | -1.5 | 6.4 | 1.4 | 2.9 | 8.2 |
| Philip Rivers | 16.4 | 16.3 | 16.4 | 14 | 14.6 | 2.4 | 3.5 | 12.9 | 10.5 | 11.1 |
| Russell Wilson | 19.8 | 19.9 | 19.8 | 14.9 | 14.6 | 4.9 | 33.5 | 13.7 | 18.6 | 18.9 |
| Tom Brady | 17.9 | 16.1 | 17.9 | 19.7 | 14.6 | -1.8 | 35.7 | 17.8 | 16 | 21.1 |
| Trevor Siemian | 15.5 | 15.1 | 15.5 | 13.9 | 14.6 | 1.6 | 7.6 | 7.9 | 6.3 | 7 |
| Tyrod Taylor | 17.7 | 19.4 | 17.7 | 12.8 | 14.6 | 4.9 | 17.8 | 0.1 | 5 | 3.2 |
| Average | 16.4 | 16.5 | 16.1 | 13.2 | 14.6 | 2.7 | 17.5 | 6.9 | 8.3 | 7.4 |
| Strd Dev. | 5.7 | 5.6 | 7.3 |
While over the first two weeks, my higher than average projections caused the results to be off, they proved themselves this week. The actual weekly average of 17.5 points was this season's highest weekly total. Overall, my projections were off by an average 6.9 points while the standard RotoWire projections were at 8.3 points off. The spread (standard deviation) was similar between the two systems.
Most of my misses (Brady, Flacco, Brissett, Wilson, Rivers) were also missed by the standard projections. Where my system did better was nailing some guys who the standard system was undervalued like Tyrod Tayler (0.1 points vs. 5.0 points off), Josh McCown (0.2 points vs. 7.2 points off) and Carson Palmer (0.7 points vs. 5.3 points). Who knows how far off the numbers will be next week, but I will take one good week. It may be my last.
Even though my projections work, I think I can keep improving them. While I planned to add defensive values to the equation this week, I made an improvement to quarterbacks instead, in-season target inclusion. While previous season data is useful, the addition of in-season data is a major improvement.
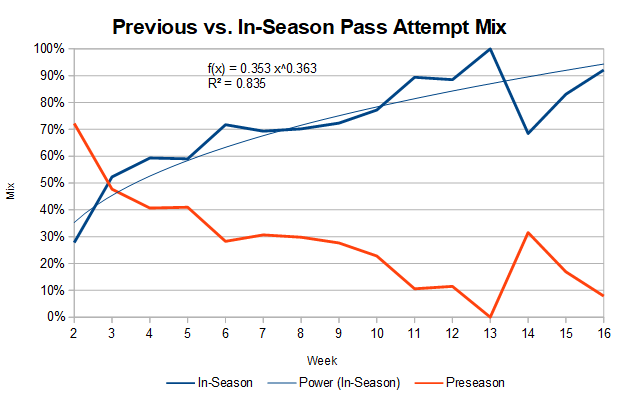
Using data from 1990 to 2016, I found out how much to weight previous and in-season pass attempts to predict the next game's rate. Here's a graph of the results

While preseason information never becomes irrelevant, it is only half of the estimate around Weeks 3 and 4. This three-week span likely applies to in-season data production as well. If a quarterback throws a ton of passes over a couple of weeks, it's important to notice the change and give him a 50/50 mix of old and new data. Don't go all in on historic or recent data. It will be a mix of both. If the trend continues, it can be believed more and more.
By week 10, 80 percent of the pass attempts should be in-season data. The in-season data doesn't completely take over but it's close by season's end.
By adding in the in-season pass attempts, I've created Week 4's quarterback projections.
| PLAYER | PROJ PA | VEGAS POINTS | PA POINTS | HYBRID | ROTOWIRE | DIFF |
| Aaron Rodgers | 41.3 | 18.7 | 22.3 | 22.3 | 21.6 | 0.7 |
| Russell Wilson | 35.6 | 19.9 | 20.9 | 20.9 | 20.0 | 0.9 |
| Drew Brees | 40.0 | 16.2 | 18.9 | 18.9 | 21.2 | -2.3 |
| Carson Palmer | 41.6 | 15.5 | 18.4 | 18.4 | 17.3 | 1.1 |
| Tom Brady | 37.6 | 16.1 | 18.1 | 18.1 | 23.1 | -5.0 |
| Matthew Stafford | 36.4 | 17.6 | 17.7 | 17.7 | 15.7 | 2.1 |
| Kirk Cousins | 35.6 | 18.4 | 17.7 | 17.7 | 16.6 | 1.1 |
| Matt Ryan | 32.3 | 19.4 | 17.2 | 17.2 | 20.7 | -3.5 |
| Cam Newton | 31.3 | 19.2 | 17.2 | 17.2 | 15.7 | 1.5 |
| Ben Roethlisberger | 36.0 | 16.1 | 17.0 | 17.0 | 15.8 | 1.2 |
| Philip Rivers | 36.6 | 16.3 | 17.0 | 17.0 | 17.4 | -0.4 |
| Carson Wentz | 38.3 | 15.0 | 17.0 | 17.0 | 16.9 | 0.1 |
| Andy Dalton | 33.4 | 16.7 | 16.8 | 16.8 | 15.8 | 1.0 |
| Dak Prescott | 31.9 | 18.4 | 16.8 | 16.8 | 18.3 | -1.5 |
| Eli Manning | 38.3 | 14.4 | 16.7 | 16.7 | 15.0 | 1.8 |
| Tyrod Taylor | 28.0 | 19.4 | 16.4 | 16.4 | 16.9 | -0.5 |
| Marcus Mariota | 31.4 | 17.8 | 16.3 | 16.3 | 17.5 | -1.2 |
| Jameis Winston | 35.4 | 10.8 | 16.2 | 16.2 | 16.9 | -0.7 |
| Alex Smith | 30.7 | 18.7 | 16.1 | 16.1 | 16.8 | -0.7 |
| Blake Bortles | 34.8 | 15.1 | 16.1 | 16.1 | 15.5 | 0.5 |
| Derek Carr | 34.4 | 17.4 | 15.9 | 15.9 | 15.9 | -0.0 |
| Case Keenum | 33.4 | 10.9 | 15.4 | 15.4 | 12.4 | 3.0 |
| Trevor Siemian | 34.1 | 15.1 | 15.4 | 15.4 | 16.8 | -1.4 |
| Brian Hoyer | 33.2 | 15.1 | 15.0 | 15.0 | 10.6 | 4.4 |
| Joe Flacco | 34.1 | 14.5 | 14.9 | 14.9 | 13.0 | 1.9 |
| Josh McCown | 31.2 | 14.9 | 14.0 | 14.0 | 9.7 | 4.3 |
| Jay Cutler | 26.7 | 16.7 | 13.1 | 13.1 | 15.8 | -2.7 |
| Deshaun Watson | 32.1 | 12.2 | 12.2 | 13.3 | -1.1 | |
| DeShone Kizer | 32.0 | 12.1 | 12.1 | 10.7 | 1.5 | |
| Jacoby Brissett | 24.0 | 16.9 | 12.0 | 12.0 | 9.1 | 2.9 |
| Jared Goff | 28.3 | 14.2 | 12.0 | 12.0 | 16.9 | -4.9 |
| Mike Glennon | 21.3 | 16.0 | 10.3 | 10.3 | 11.2 | -0.9 |
| Average | 33.5 | 16.1 | 16.3 | 16.0 | 15.9 | 0.1 |
The two projection results have melded to similar values. Only four players are off by more than four points. I'm higher on McCown and Hoyer and lower on Brady and Goff. Additionally, the average values are only 0.1 off, so the two projection systems are closer after being separated by ~3 points last week.
Wide Receivers
Last week may have been the first and last week for wide receiver projections this year. The basic issue is that I don't have access to an in-season database to link my rate projections and target estimates. I already match the quarterback information by hand, but they are limited to about 30 players who rarely change. With wide receivers, I would need to match up data on 100-plus players. I just don't have the time.
I went back and looked at the top wide receivers from last week and which projection system did best on these few guys. It wasn't mine.
| PLAYER | ACTUAL | ROTOWIRE | DIFF | ZMAN'S | DIFF |
| Stefon Diggs | 29.3 | 8.1 | 21.2 | 7.4 | 21.9 |
| Brandin Cooks | 27.1 | 11.0 | 16.2 | 7.7 | 19.4 |
| Sammy Watkins | 22.6 | 8.6 | 14.0 | 4.8 | 17.8 |
| T.Y. Hilton | 21.3 | 8.3 | 13.0 | 9.5 | 11.8 |
| Larry Fitzgerald | 20.9 | 8.2 | 12.7 | 8.3 | 12.6 |
| Sterling Shepard | 19.3 | 7.0 | 12.3 | 6.4 | 12.9 |
| Chris Hogan | 18.8 | 7.7 | 11.1 | 4.9 | 13.9 |
| Jordy Nelson | 17.2 | 11.9 | 5.3 | 6.6 | 10.6 |
| A.J. Green | 17.1 | 13.3 | 3.8 | 10.5 | 6.6 |
| Antonio Brown | 17.0 | 15.3 | 1.7 | 11.1 | 5.9 |
| Doug Baldwin | 16.5 | 10.6 | 5.9 | 8.5 | 8.0 |
| Robby Anderson | 15.5 | 4.7 | 10.8 | 4.8 | 10.7 |
| Brice Butler | 15.0 | 2.5 | 12.5 | 2.3 | 12.7 |
| Tyreek Hill | 15.0 | 10.9 | 4.1 | 8.1 | 6.9 |
| Rishard Matthews | 14.7 | 8.3 | 6.4 | 6.4 | 8.3 |
| Michael Thomas | 14.7 | 10.9 | 3.8 | 11.5 | 3.2 |
| DeSean Jackson | 14.4 | 8.3 | 6.1 | 6.0 | 8.4 |
| Pierre Garcon | 14.2 | 8.5 | 5.7 | 6.7 | 7.5 |
| Taylor Gabriel | 13.9 | 7.2 | 6.7 | 5.0 | 8.9 |
| DeVante Parker | 13.6 | 10.0 | 3.7 | 8.1 | 5.5 |
| Geronimo Allison | 12.2 | 8.5 | 3.7 | 4.6 | 7.6 |
| Ted Ginn | 11.9 | 8.1 | 3.8 | 4.4 | 7.5 |
| Golden Tate | 11.8 | 10.3 | 1.5 | 5.4 | 6.4 |
| Average | 17.1 | 9.0 | 8.1 | 6.9 | 10.2 |
My projections on this player set were lower, so when they overperformed, I was way off with the top guys. The issue is that I don't know the results for all the players. Hopefully, I can at a future date.
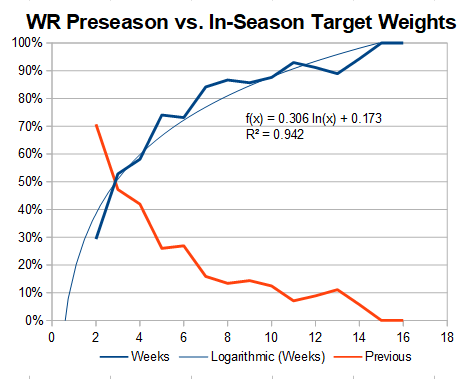
One piece of information I extracted before moving on was how much to weigh preseason and in-season targets. Here's the information.

The resulting weights are like the quarterback numbers with the in-season data taking precedence around week three. Additionally, the in-season becomes 100 percent of the projection in week 15. In the last couple weeks, all preseason can be thrown out.
I think that I'm able to continue to make progress but for now, I won't be able to advance future with wide receivers until I fix my database issue. Incorporating some opposing defensive values is still a major step for the quarterbacks. I hope to do them for next week. Until them, good luck setting your lineups.


