

No NFL fan needs the pain of watching their team relinquish a surefire win by collapsing just before the finish line, but some are far more intimate with that form of heartbreak than others. In our latest NFL news piece, RotoWire.com updates data on every regular-season game since 2000 to see which teams have lost most often after leading through three quarters, creating a data spread that we affectionately suggest labeling the "Anti-Clutch Index."
Methodology: Filtering for all regular-season games from 2000 through Week 9 of the 2025 NFL season using Stathead's Team Game Finder tool, we filtered for contests in which a team held a scoring margin of at least +1 through the third quarter. Then, we weighted each team's wins and loss records in those games by a primary metric of total losses when leading through three quarters, with blown lead percentage (losses ÷ games leading through three quarters) as a tiebreaker.
Below, the Anti-Clutch Index paints a picture of how often each NFL franchise has let victory slip through their fingers so far this season, followed by the updated chart encompassing the last 25+ seasons.
2025 NFL Mid-Season Data
Rank | Team | Games Led through 3Q | Losses and Ties | W | Blown Lead % |
1 | ARI | 6 | 3 | 3 | 50% |
2 | NYJ | 2 | 2 | 0 | 100% |
3 | LVR | 4 | 2 | 2 | 50% |
T-4 | DEN | 5 | 2 | 3 | 40% |
T-4 | DAL | 5 | 2 | 3 | 40% |
6 | CLE | 2 | 1 | 1 | 50% |
T-7 | CIN | 3 | 1 | 2 | 33% |
T-7 | MIA | 3 | 1 | 2 | 33% |
T-7 | NYG | 3 | 1 | 2 | 33% |
T-10 | CHI | 4 | 1 | 3 | 25% |
T-10 | GNB | 4 | 1 | 3 | 25% |
T-10 | HOU | 4 | 1 | 3 | 25% |
T-10 | BAL | 4 | 1 | 3 | 25% |
T-10 | WAS | 4 | 1 | 3 | 25% |
15 | PIT | 5 | 1 | 4 | 20% |
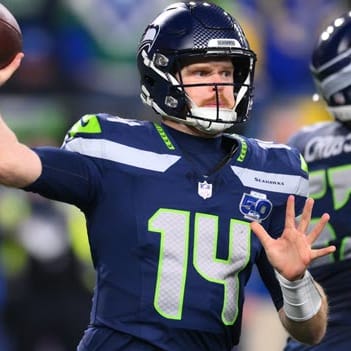
T-16 | PHI | 6 | 1 | 5 | 17% |
T-16 | SEA | 6 | 1 | 5 | 17% |
18 | LAR | 7 | 1 | 6 | 14% |
T-19 | NWE | 7 | 0 | 7 | 0% |
T-19 | TAM | 6 | 0 | 6 | 0% |
T-19 | BUF | 5 | 0 | 5 | 0% |
T-19 | IND | 5 | 0 | 5 | 0% |
T-19 | KAN | 5 | 0 | 5 | 0% |
T-19 | LAC | 5 | 0 | 5 | 0% |
T-19 | DET | 4 | 0 | 4 | 0% |
T-19 | JAX | 4 | 0 | 4 | 0% |
T-19 | SFO | 4 | 0 | 4 | 0% |
T-19 | ATL | 3 | 0 | 3 | 0% |
T-19 | CAR | 3 | 0 | 3 | 0% |
T-19 | MIN | 2 | 0 | 2 | 0% |
T-19 | NOR | 1 | 0 | 1 | 0% |
While the NFL regular season is not quite at its halfway point, it's safe to say that certain teams have struggled keeping leads when compared with their peers. One such exemplar of late game ineptitude is the 3-5  Arizona Cardinals, who have led six games through three quarters, only to lose half of those contests.
Those three blown leads put Arizona ahead of other NFL come-from-ahead choke artists like the New York Jets, who are one of four NFL teams to have blown two games where they led after three quarters, joining the Las Vegas Raiders, Denver Broncos and Dallas Cowboys in that illustrious camp.
Of that quintet of teams at the top of our blown leads leaderboard, only the 7-2 Denver Broncos are over .500, while the Cowboys (3-5-1), Cardinals (3-5), Raiders (2-6) and Jets (1-7) are all wallowing in mediocrity this season.
Overall, the team with the highest blown lead percentage this season has been the 1-7 Jets, who are 2-for-2 in losing games that they've led after three quarters, making Year One of the Aaron Glenn era one to forget for football fans in the New York area.
Conversely, 13 NFL teams have yet to blow a lead after leading through three quarters of play, with the 7-2  New England Patriots having the most opportunities to do so (seven), while the New Orleans Saints are on the other end of the spectrum, leading one game at that juncture this season.
NFL's Most Blown Leads Since 2000
Rank | Team | Games Led through 3Q | Losses and Ties | Wins | Blown Lead % |
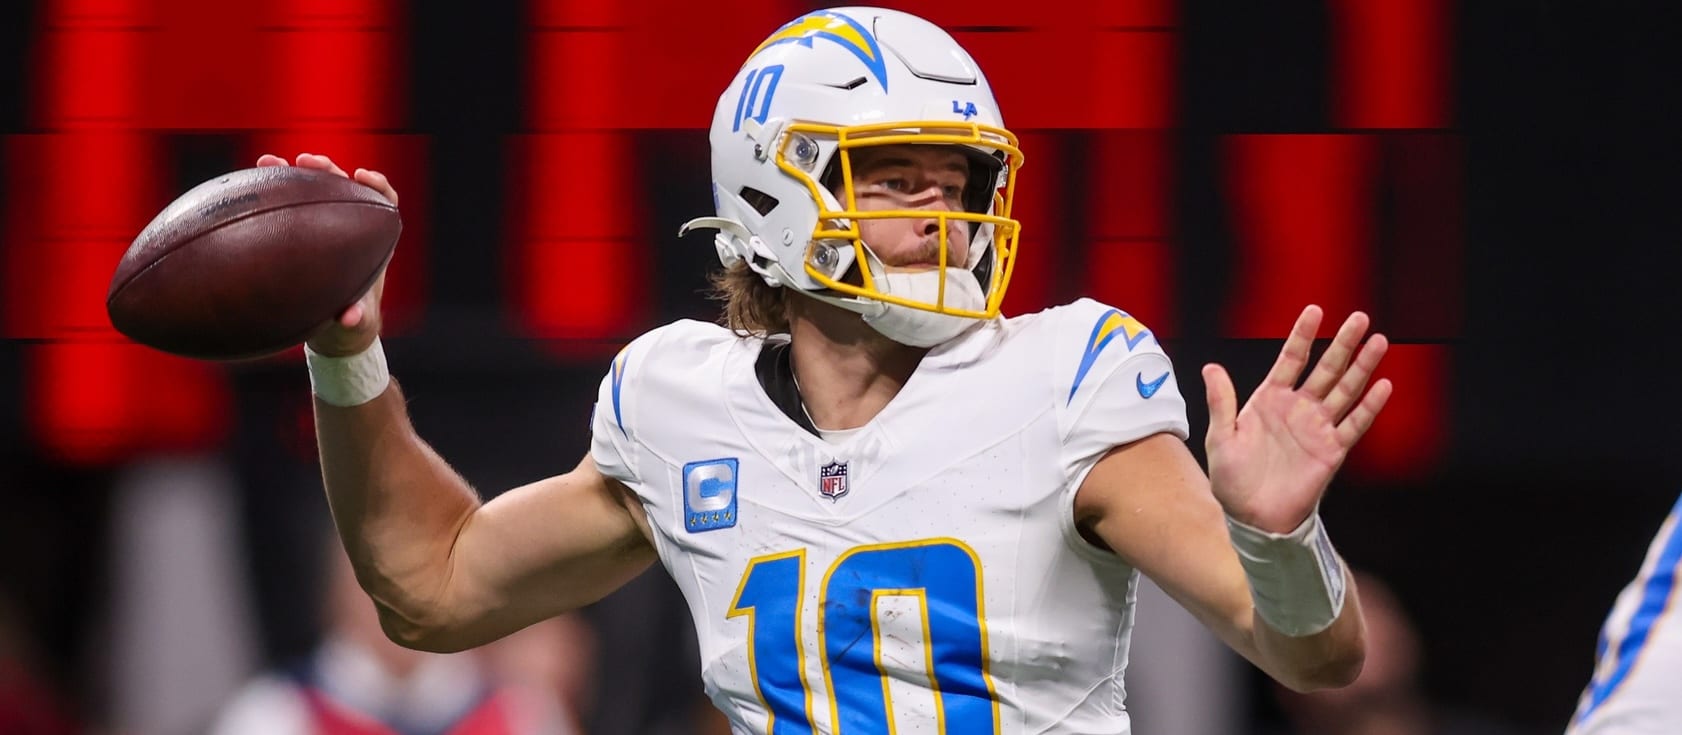
1 | LAC | 209 | 47 | 162 | 22.5% |
2 | DET | 164 | 45 | 119 | 27.4% |
3 | CLE | 149 | 43 | 106 | 28.9% |
4 | WAS | 171 | 40 | 131 | 23.4% |
5 | CHI | 183 | 40 | 143 | 21.9% |
6 | CIN | 186 | 38 | 148 | 20.4% |
7 | DEN | 212 | 38 | 174 | 17.9% |
8 | BUF | 199 | 37 | 162 | 18.6% |
9 | JAX | 156 | 36 | 120 | 23.1% |
10 | HOU | 160 | 36 | 124 | 22.5% |
11 | DAL | 202 | 36 | 166 | 17.8% |
12 | CAR | 188 | 35 | 153 | 18.6% |
13 | SFO | 201 | 35 | 166 | 17.4% |
14 | NYG | 175 | 33 | 142 | 18.9% |
15 | TAM | 182 | 33 | 149 | 18.1% |
16 | LVR | 155 | 32 | 123 | 20.6% |
17 | MIA | 183 | 32 | 151 | 17.5% |
18 | KAN | 216 | 32 | 184 | 14.8% |
19 | BAL | 242 | 32 | 210 | 13.2% |
20 | NYJ | 160 | 31 | 129 | 19.4% |
21 | TEN | 182 | 31 | 151 | 17.0% |
22 | LAR | 186 | 31 | 155 | 16.7% |
23 | IND | 218 | 31 | 187 | 14.2% |
24 | PHI | 229 | 31 | 198 | 13.5% |
25 | SEA | 221 | 30 | 191 | 13.6% |
26 | ARI | 152 | 29 | 123 | 19.1% |
27 | ATL | 183 | 27 | 156 | 14.8% |
28 | PIT | 227 | 27 | 200 | 11.9% |
29 | GNB | 237 | 27 | 210 | 11.4% |
30 | NOR | 211 | 25 | 186 | 11.8% |
31 | MIN | 197 | 23 | 174 | 11.7% |
32 | NWE | 248 | 16 | 232 | 6.5% |
Chargers Lead NFL in Collapses Since 2000
Panning out a bit, the NFL team that's been on the wrong end of a fourth quarter lead the most has been the  Los Angeles Chargers, who have blown 47 of the 209 games they've led through three quarters of play, averaging out to a 22.5% blown lead figure in the City of Angels.
The good news? They've yet to blow a lead this season.
After Jim Harbaugh's bunch, teams like the Detroit Lions (45 blown leads/27.4% blown lead percentage), Cleveland Browns (43 blown leads/28.9% blown lead percentage), Washington Commanders (40 blown leads/23.4% blown lead percentage) and the Chicago Bears (40 blown leads/21.9% blown lead percentage) are the NFL's leaders in late game futility this century.
Conversely, just like this season, the Patriots have been the standard-bearer in protecting late game advantages, with a scant 16 blown leads since 2000 in 248 games, averaging out to a meager 6.5% blown lead percentage — nearly half the figure of the next closest team (the Minnesota Vikings, at 11.7%).