There are a few different ways to split the MLB season in half:
- Using the actual halfway point, which has the advantage of being actually true but the disadvantages of being hard to find and moving from season to season.
- Using the All-Star break, which has the advantage of creative easy splits thanks to its historical position as the unofficial halfway point but the disadvantage of not actually coming particularly close to the middle of the season.
- Using the end of June, which is also easy to find and approximates the 50 percent mark much better, even if it's typically off by a couple days.
For this week's MLB Barometer, we'll use the latter method. I'll be repeating an exercise I like to do a few times per season, using the RotoWire Earned Auction Value Calculator to pick this week's Risers and Fallers. I've compared each player's rank in earned value so far to his average draft position in all RotoWire Online Championship drafts which took place in the month of March. We'll go position group by position group, marking the players who have risen or fallen the most, though we'll begin with a group of risers from within the top-50 picks, as those moves are often the most significant even though it's hard to move too many spots within this range.
The boring technical bits: for the risers, I've ranked them by percent of possible spots gained (% Gain) rather than raw number of spots gained, because it's more
There are a few different ways to split the MLB season in half:
- Using the actual halfway point, which has the advantage of being actually true but the disadvantages of being hard to find and moving from season to season.
- Using the All-Star break, which has the advantage of creative easy splits thanks to its historical position as the unofficial halfway point but the disadvantage of not actually coming particularly close to the middle of the season.
- Using the end of June, which is also easy to find and approximates the 50 percent mark much better, even if it's typically off by a couple days.
For this week's MLB Barometer, we'll use the latter method. I'll be repeating an exercise I like to do a few times per season, using the RotoWire Earned Auction Value Calculator to pick this week's Risers and Fallers. I've compared each player's rank in earned value so far to his average draft position in all RotoWire Online Championship drafts which took place in the month of March. We'll go position group by position group, marking the players who have risen or fallen the most, though we'll begin with a group of risers from within the top-50 picks, as those moves are often the most significant even though it's hard to move too many spots within this range.
The boring technical bits: for the risers, I've ranked them by percent of possible spots gained (% Gain) rather than raw number of spots gained, because it's more impressive to jump from 50 to 5 than from 500 to 400. I've excluded fallers who began outside the top-180 this time around — in other words, those drafted in the first 15 rounds of a 12-team mixed league — in order to keep the focus on the players who were really supposed to move the needle this season. I've also excluded fallers whose falls come as a result of them missing more than a week due to injury, as it's not very useful for me to tell you that it's bad when your players get hurt.
Risers
| First 50 Picks | Team | Pos | March ADP Rank | Earned Value Rank | % Gain |
|---|---|---|---|---|---|
| Aaron Judge | NYY | OF | 13 | 1 | 100.0% |
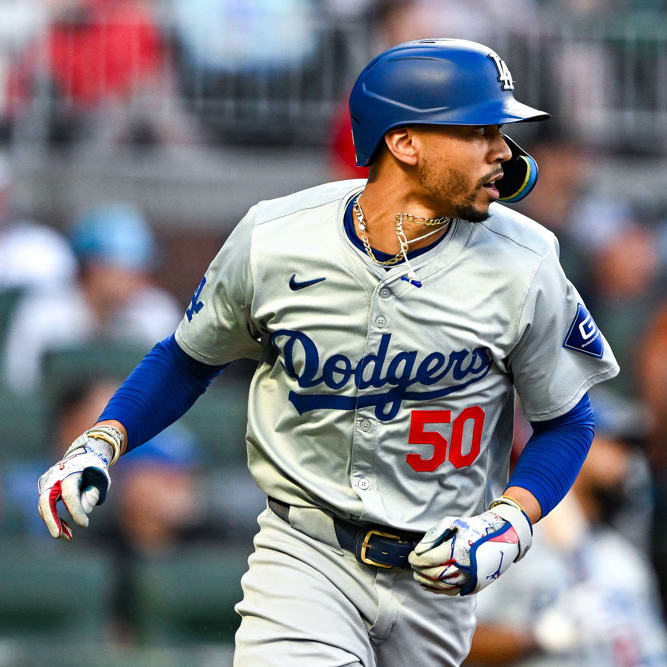
| Shohei Ohtani | LAD | UT | 11 | 2 | 90.0% |
| Gunnar Henderson | BAL | 3B, SS | 28 | 4 | 88.9% |
| Jose Ramirez | CLE | 3B | 15 | 3 | 85.7% |
| Elly De La Cruz | CIN | 3B, SS | 20 | 6 | 73.7% |
 Aaron Judge, Yankees: Two years ago, Judge's 62-homer, 133-run, 131-RBI season made him the top fantasy player by a mile, but drafters remembered his injury history the following winter and declined to make him the consensus No. 1 overall pick. That proved prescient, as injuries limited him to 106 games while his bat fell from otherworldly (209 wRC+) to merely outstanding (174 wRC+). That left him as a late first-rounder or early second-rounder this past winter, a spot which now looks like a real bargain. Injuries could still pop up in the second half, but he's started all but two games so far this season and looks to be just as good as 2022, if not better. All three elements of his .316/.436/.708 slash line are improvements on his 2022 numbers, as is his 214 wRC+. His 25.1 percent strikeout rate is an exact match for his strikeout rate from that season, and his 28.9 percent barrel rate and 63.0 percent hard hit rate (both best in the league, of course) both represent slight improvements. It's a reminder that Judge is the best hitter in the league when healthy, and he probably should have earned a bit more consideration early in the first round from drafters who aren't scared to take an early health risk.
| Catchers | Team | March ADP Rank | Earned Value Rank | % Gain |
|---|---|---|---|---|
| David Fry | CLE | 580 | 144 | 75.3% |
| William Contreras | MLW | 75 | 28 | 63.5% |
| Connor Wong | BOS | 384 | 156 | 59.5% |
| Salvador Perez | KC | 130 | 60 | 54.3% |
| Adley Rutschman | BAL | 52 | 25 | 52.9% |
 William Contreras, Brewers: Last season, Contreras came to the plate 611 times, making him the only catcher to finish within 100 plate appearances of Adley Rutschman's position-leading 687. This year, it's Contreras (374) and Rutschman (361) pacing the pack again but in the reverse order, with only Salvador Perez (338) coming within 50 of either player. That rare volume for a catcher has helped make Contreras a top-30 player in the first half, though it of course had to be combined with strong performance as well. Contreras finished June with a .291/.352/.436 slash line, 57 runs, 50 RBI, nine homers and five steals. In the battle for catcher supremacy, Rutschman provided six extra homers, and five more RBI, but 13 fewer runs and four fewer steals alongside a nearly identical average (.294). Under the hood, Contreras looks mostly the same as last season but with slight improvements, with his strikeout rate shrinking from 20.6 percent to 18.7 percent while his hard-hit rate inching up from 48.4 percent to 49.8 percent. It's a bat which looks like it belongs at another position as well as a workload which looks like it belongs to a non-catcher. That adds up to a fantasy superstar.
| Corner Infielders | Team | Pos | March ADP Rank | Earned Value Rank | % Gain |
|---|---|---|---|---|---|
| Alec Bohm | PHI | 1B, 3B | 165 | 17 | 90.2% |
| Gunnar Henderson | BAL | 3B, SS | 28 | 4 | 88.9% |
| Jordan Westburg | BAL | 2B, 3B | 308 | 44 | 86.0% |
| Jose Ramirez | CLE | 3B | 15 | 3 | 85.7% |
| Josh Naylor | CLE | 1B | 129 | 21 | 84.4% |
 Alec Bohm, Phillies: When I did a similar exercise at the end of April, Bohm showed up as the 12th-best player of the month, but I didn't see enough of an improvement in his underlying numbers to merit a write-up, figuring that he would quickly fall back to his career norms. He's technically taken a step back over the two months since then, but only enough to drop him five spots in the earned value rankings. Now that Bohm has kept this up for a full three months, it's worth taking another look to see just how much of a new player he is. You still won't find any dramatic improvements in his numbers, but instead, you'll find small steps forward in just about every area. His strikeout rate (13.5 percent), chase rate (29.9 percent) and contact rate (85.5 percent) all represent career highs, if only by small amounts, while his 8.6 percent barrel rate is his best mark since his 44-game debut back in 2020. Even if Bohm's quality of contact remains frustratingly middling, putting the ball in plate this often has helped him to a .297/.349/.484 line with 10 homers in 83 games. Taking small but real steps forward in his age-27 season has helped Bohm become a great run producer given his role as the primary cleanup man in one of the league's top lineups, as his 68 RBI are third-most in the league.
| Middle Infielders | Team | Pos | March ADP Rank | Earned Value Rank | % Gain |
|---|---|---|---|---|---|
| Brice Turang | MLW | 2B, SS | 341 | 12 | 96.8% |
| Ketel Marte | ARZ | 2B | 112 | 13 | 89.2% |
| Gunnar Henderson | BAL | 3B, SS | 28 | 4 | 88.9% |
| Jordan Westburg | BAL | 2B, 3B | 308 | 44 | 86.0% |
| Jackson Merrill | SD | OF, SS | 264 | 41 | 84.8% |
 Jackson Merrill, Padres: Merrill was a fun story this spring, with the Padres giving him a legitimate chance to be their Opening Day center fielder despite the fact that he'd never played the position in the minors and had never played above Double-A, where he'd played a modest 46 games and hardly set the world on fire (104 wRC+). Scouts liked Merrill's hit tool, and his 11.8 percent strikeout rate at Double-A reinforced the notion that he had strong bat-to-ball skills, but it seemed a lot to ask to expect him to do anything more than hold his own as a rookie who couldn't even legally drink until nearly a month after his big-league debut. Instead, Merrill has thrived, hitting .291/.325/.459 with 12 homers and nine steals. The bat-to-ball skills have translated, with Merrill's 16.5 percent strikeout rate and .298 xBA indicating his high batting average is well-deserved, but the big surprise is that his plus contact has been joined by at least average power. His 8.6 percent barrel rate is a slightly above-average mark, and when you put the ball in play as often as he does, average raw power is enough to lead to an above-average number of home runs.
| Outfielders | Team | Pos | March ADP Rank | Earned Value Rank | % Gain |
|---|---|---|---|---|---|
| Aaron Judge | NYY | OF | 13 | 1 | 100.0% |
| Jurickson Profar | SD | OF | 524 | 20 | 96.4% |
| Jarren Duran | BOS | OF | 132 | 10 | 93.1% |
| Jesse Winker | WAS | OF | 580 | 75 | 85.2% |
| Jackson Merrill | SD | OF, SS | 264 | 41 | 84.8% |
 Jurickson Profar, Padres: Time travelers from the year 2012, when Profar had just debuted as a 19-year-old shortstop, might not be too surprised to find out that Profar is one of the top outfielders in baseball 12 years later. But those of us who have seen him in the intervening years are a bit confused. Profar hit a modest .238/.322/.383 in 961 career games prior to this season, but he finished the first half slashing .314/.408/.476 in 86 contests. He added 11 homers and four steals, unremarkable totals but enough to give him a shot at a 20/10 season, something he's done just once in his career. Profar is benefitting from a .347 BABIP, but his .294 xBA and .443 xSLG indicate that he's earning the majority of his success thus far. The veteran outfielder hasn't made major changes under the hood, but he has made small ones. His 14.7 percent strikeout rate is his best mark since 2020, and his 12.4 percent walk rate is the highest of his career (excluding a 22-game stint in 2017). His 40.3 percent hard hit rate and 6.5 percent barrel rate also both represent career highs, even if neither is particularly impressive. Don't expect Profar to remain a top-20 player going forward, but his strong first half wasn't entirely a fluke.
| Starting Pitchers | Team | March ADP Rank | Earned Value Rank | % Gain |
|---|---|---|---|---|
| Seth Lugo | KC | 258 | 11 | 96.1% |
| Ranger Suarez | PHI | 322 | 18 | 94.7% |
| Garrett Crochet | CWS | 356 | 34 | 90.7% |
| Ronel Blanco | HOU | 479 | 53 | 89.1% |
| Tanner Houck | BOS | 342 | 48 | 86.2% |
 Garrett Crochet, White Sox: Each of the five pitchers in the table above has meaningfully improved their fantasy stock going forward, but for the other four on the list, their outstanding first halves were powered in part by them outperforming their peripherals. For Crochet, the opposite is true. He finished June with a 3.02 ERA and 0.93 WHIP in 18 starts, but his ERA estimators (2.38 ERA, 2.37 FIP, 2.33 xFIP, 2.37 SIERA) unanimously agreed that he was much better than that. Each of those marks ranks first or second among qualified starters, suggesting that Crochet would be one of the favorites for American League Cy Young if he were allowed to chase the award in the second half. Unfortunately, Crochet is highly unlikely to produce this kind of value over the final three months of the year, as the White Sox have already indicated that his workload is set to diminish. The lefty missed all of 2022 due to Tommy John surgery and threw just 25 innings last year after returning to action, and with the White Sox as far as possible from contention, there's no reason to risk re-injury. Just how many more starts Crochet is allowed to make this season remains unclear, but one thing isn't in any doubt: given Crochet's elite numbers thus far, which are backed by a remarkable 35.3 percent strikeout rate and a 5.0 percent walk rate, he's going to be taken very early in drafts next season.
| Relief Pitchers | Team | March ADP Rank | Earned Value Rank | % Gain |
|---|---|---|---|---|
| Bryan Hudson | MIL | 580 | 113 | 80.7% |
| Kirby Yates | TEX | 580 | 172 | 70.5% |
| Jared Koenig | MIL | 580 | 200 | 65.6% |
| Ryan Walker | SF | 580 | 205 | 64.8% |
| Hunter Gaddis | CLE | 580 | 226 | 61.1% |
 Kirby Yates, Rangers: The other four names listed above are relievers who managed to pick up a few wins alongside some strong ratios over a three-month period — all interesting fantasy options in the right context, but not the sort of player that has much appeal going forward in most formats. Yates, on the other hand, has emerged to become a true closer and quite a good one at that. The 37-year-old has experience in the ninth inning, recording 41 saves and a 1.19 ERA back in 2019, but his career had since been sidetracked by injury. He pitched well with Atlanta last year, however, recording a 3.28 ERA and five saves, so he probably should have gotten more buzz when the Rangers signed him this past offseason. Instead, the attention went to David Robertson as the most likely pitcher to take over the closer role should Jose Leclerc pitch his way out of the job. It's hard to say that anyone who drafted Robertson had a bad process, as Leclerc did indeed lose the ninth inning almost right away and Robertson did indeed pitch well, recording a 37.8 percent strikeout rate and 3.34 ERA thus far. But the ninth inning has instead gone to Yates, who has nearly as strong of a strikeout rate (34.2 percent) and a much better ERA (0.95). With just three earned runs allowed all season, there's little reason to fear for his role any time soon.
Fallers
| Catchers | Team | March ADP Rank | Earned Value Rank | Drop |
|---|---|---|---|---|
| Keibert Ruiz | WAS | 179 | 566 | 387 |
| Bo Naylor | CLE | 171 | 548 | 377 |
| Gabriel Moreno | ARZ | 160 | 438 | 278 |
| J.T. Realmuto | PHI | 72 | 324 | 252 |
| Mitch Garver | SEA | 168 | 390 | 222 |
 J.T. Realmuto, Phillies: Realmuto's placement here is partially due to the fact that he's missed a few weeks with a knee injury, yet not quite enough to disqualify him for this article. But even before undergoing meniscus surgery in mid-June, Realmuto was falling short of expectations. In 51 games, he slashed .261/.309/.411 (good for a 103 wRC+) with seven homers. At age 33, he looks like a player who's starting to expand the zone in order to keep his dwindling power alive. The result has been a career-best hard hit rate (48.0 percent) but a career-worst strikeout rate (26.9 percent) and his worst walk rate (5.4 percent) since 2016. Realmuto has recently begun hitting on the field and appears set to return shortly after the All-Star break, at which point we'll see whether those changes were merely a small-sample blip or the sign of a new, seemingly worse approach. We'll also see whether the speed which makes Realmuto an outlier among catchers has any hope of returning. He stole 50 bases from 2021 to 2023 while no other catcher stole more than 15, but he had just one prior to the injury, and a 33-year-old backstop coming off knee surgery isn't a great bet to run.
| Corner Infielders | Team | Pos | March ADP Rank | Earned Value Rank | Drop |
|---|---|---|---|---|---|
| Spencer Torkelson | DET | 1B | 118 | 569 | 451 |
| Jake Burger | MIA | 1B/3B | 143 | 404 | 261 |
| Ke'Bryan Hayes | PIT | 3B | 148 | 406 | 258 |
| Austin Riley | ATL | 3B | 18 | 198 | 180 |
| Matt Olson | ATL | 1B | 14 | 146 | 132 |
 Jake Burger, Marlins: Burger broke out in the first half last year, homering 25 times in 88 games and earning a move from the White Sox to the Marlins. After the trade, his batting average soared from .214 to .303 as his strikeout rate plummeted from 31.6 percent to 21.7 percent, all while his barrel rate (13.1 percent) remained excellent. That left Burger as a player worth dreaming on this past winter, as someone who put the injury troubles which plagued his time in the minors behind him and was showing genuine growth as he entered his peak seasons. That growth hasn't been entirely undone this year, but Burger's first three months represent a clear step back. He's slashed a poor .221/.259/.361 (73 wRC+) with eight homers in 63 games, and the numbers under the hood aren't very encouraging. He's given back about half the gains in his strikeout rate, which is back up at 25.1 percent, and that hasn't been as part of a tradeoff to get back any lost power. Instead, his barrel rate sits at a career-low 10.5 percent. There's still time for Burger to shake off the malaise in Miami, especially if he gets traded into a more favorable park and a better surrounding lineup, but if his slump drags on for another few months, he'll begin to look like a one-year wonder.
| Middle Infielders | Team | Pos | March ADP Rank | Earned Value Rank | Drop |
|---|---|---|---|---|---|
| Bo Bichette | TOR | SS | 37 | 334 | 297 |
| Zack Gelof | OAK | 2B | 122 | 279 | 157 |
| Dansby Swanson | CHC | SS | 125 | 274 | 149 |
| Gleyber Torres | NYY | 2B | 70 | 214 | 144 |
| Ozzie Albies | ATL | 2B | 22 | 145 | 123 |
 Gleyber Torres, Yankees: Torres had been on an upward trend over the last three seasons, with his OPS rising from .697 to .761 to .800 — still lower than his .872 OPS from his career year back in 2019, but encouraging enough to make him look like a good bet in his age-27 season. Rather than return to his heyday, however, Torres has turned in a career-worst performance in what ought to be a peak season. His .226/.299/.351 slash line represents career lows in all three categories, with his 88 wRC+ representing a career low as well. The biggest change for Torres has been his strikeout rate, which sits at 23.5 percent this season, well above his 14.6 percent mark from last season. Last year's mark was the clear outlier, as he struck out 21.9 percent of the time through the end of the 2022 season, but it's still surprising to see him give up all of his gains and then some. An increase in whiffs wouldn't be a problem if it came with more power, but instead, the opposite has happened. His 35.2 percent hard hit rate is a career low, while his 6.1 percent barrel rate only beats his mark from the short 2020 campaign. The fact that the poster child of the 2019 juiced ball would be struggling this year with a deader ball isn't a big surprise, and we might not have drafted Torres where we did had we known the state of the ball back in draft season, but it would be wrong to blame the ball for the majority of Torres' struggles.
| Outfielders | Team | Pos | March ADP Rank | Earned Value Rank | Drop |
|---|---|---|---|---|---|
| Jordan Walker | STL | OF | 113 | 1089 | 976 |
| James Outman | LAD | OF | 176 | 816 | 640 |
| Chas McCormick | HOU | OF | 149 | 481 | 332 |
| Michael Harris | ATL | OF | 26 | 267 | 241 |
| Corbin Carroll | ARZ | OF | 6 | 218 | 212 |
 Chas McCormick, Astros: McCormick seemingly had a lot going for him to make him a very appealing mid-round pick this past winter. He was coming off a year in which he'd hit .273/.353/.489 with 22 homers and 19 steals in 457 plate appearances, and given the managerial change in Houston following Dusty Baker's retirement, it seemed fair to wonder if McCormick could go 25-25 or even threaten 30-30 if installed as a true everyday regular, a role he seemingly had earned. Instead, it now appears that Baker might know a thing or two about baseball after all. McCormick has been limited to just 150 plate appearances this year, and while some of that stems from a hamstring injury which cost him the first three weeks of May, it's primarily a reflection of the fact that he hasn't earned everyday at-bats. He's hitting just .213/.273/.331, good for a 72 wRC+, and his three homers and five steals put him on pace for 12 and 20 over the course of 600 trips to the plate. He's striking out 29.3 percent of the time, the worst mark since his rookie season, and he's managed a career-low hard-hit rate (36.2 percent). Those marks aren't too much worse than his 25.6 percent strikeout rate and 38.8 percent hard hit rate from last season, both of which were sub-par, so it's perhaps time to wonder why there was so much optimism for a 29-year-old who'd never previously been more than a part-timer in the first place.
| Starting Pitchers | Team | March ADP Rank | Earned Value Rank | Drop |
|---|---|---|---|---|
| Kevin Gausman | TOR | 40 | 388 | 348 |
| Framber Valdez | HOU | 56 | 336 | 280 |
| Hunter Brown | HOU | 152 | 389 | 237 |
| Zach Eflin | TB | 68 | 285 | 217 |
| Luis Castillo | SEA | 27 | 196 | 169 |
 Luis Castillo, Mariners: Castillo certainly didn't have a disaster of a first half, and his pitcher-friendly home park in Seattle helps prop him up even when he struggles, but this is not the Luis Castillo we're used to seeing. In the first six seasons of his career, Castillo was excellent at keeping the ball on the ground, posting groundball rates between 45.9 percent and 58.8 percent each year and averaging 52.7 percent. That might have something to do with the fact that the first 5.5 of those seasons were spent at Great American Ball Park in Cincinnati, the most homer-friendly park in the league. After moving to a pitcher's paradise in Seattle, the incentive to avoid flyballs decreased, so it's no surprise he produced a career-low 38.9 percent groundball rate last year. He kept missing bats even while giving up more flyballs, however, with his 27.3 percent strikeout rate coming in above his career average (26.3 percent). This year, Castillo's groundball rate has dipped still further (36.5 percent), but he's also suddenly lost the whiffs, with his 23.8 percent strikeout rate nearly representing a career low. The 31-year-old does at least still have above-average control (6.9 percent walk rate), but the whole picture has added up to a pedestrian 3.87 ERA, a mark which looks entirely fair according to his ERA estimators (3.85 FIP, 3.85 xFIP, 3.83 SIERA).
| Relief Pitchers | Team | March ADP Rank | Earned Value Rank | Drop |
|---|---|---|---|---|
| Edwin Diaz | NYM | 43 | 427 | 384 |
| Alexis Diaz | CIN | 78 | 364 | 286 |
| Camilo Doval | SF | 56 | 336 | 280 |
| Jose Leclerc | TEX | 178 | 450 | 272 |
| Evan Phillips | LAD | 77 | 306 | 229 |
 Camilo Doval, Giants: Heading into the year, if you'd told me that Doval would show up as one of the most disappointing relievers of the first half, I would have assumed that the Giants had gone back to their save-sharing ways of previous seasons. That hasn't been the case, as Doval has all but one of the team's saves this year. His placement here is partially due to the fact that the Giants haven't generated many saves as a team this season (15, with only the Rangers and Marlins recording fewer), but it's also due to the fact that Doval simply hasn't been very good. He entered the year with a career 2.77 ERA and 1.16 WHIP in 162.1 innings, but he's struggled to a 4.41 ERA and 1.59 WHIP in 32.2 frames this year. As you might suspect from that WHIP, walks are the primary problem. His strikeout rate has dipped slightly from 30.2 percent to 27.8 percent, but his previous 9.6 percent career walk rate has ballooned to 14.6 percent. Zooming into the per-pitch level, his ball rate has gone from 36.6 percent to 37.7 percent, which is a step back but not a particularly large one. There's still time for Doval to shake off a rocky first half and finish with respectable numbers, but it's been an undeniable step back thus far.


