It's that time of the season where I like to take an early look under the hood to see what the numbers can tell us for the potential impact of home runs, or the lack thereof, the rest of the season. I've written this article this same weekend the past few seasons, most recently almost one calendar year to the date this will be published. The season is already 5.9 percent complete, with 143 contests played between the 30 teams, so it's a good time to look at how the start of this season compares to the sluggish one we had last season with power as well as how the running game is holding up after an active spring training.
The early talk this season is mostly centered around torpedo bats and how the ball is seemingly more juiced this season. If you only watched the opening series in New York when the Yankees hosted the Brewers or the Sacramento series when the Athletics hosted the Cubs, your perception is well-founded. We have seen some largess elsewhere, too, including last night in Boston as the Red Sox hung two touchdowns, two 2-point conversions, and a safety on the Cardinals, but we've also seen the Reds shut out in three consecutive contests by a score of 1-0.
Fortunately, we can pause the numbers as play wrapped up on April 6th and get an excellent comparison to last year's numbers, because we are at the exact same number of contests played in
It's that time of the season where I like to take an early look under the hood to see what the numbers can tell us for the potential impact of home runs, or the lack thereof, the rest of the season. I've written this article this same weekend the past few seasons, most recently almost one calendar year to the date this will be published. The season is already 5.9 percent complete, with 143 contests played between the 30 teams, so it's a good time to look at how the start of this season compares to the sluggish one we had last season with power as well as how the running game is holding up after an active spring training.
The early talk this season is mostly centered around torpedo bats and how the ball is seemingly more juiced this season. If you only watched the opening series in New York when the Yankees hosted the Brewers or the Sacramento series when the Athletics hosted the Cubs, your perception is well-founded. We have seen some largess elsewhere, too, including last night in Boston as the Red Sox hung two touchdowns, two 2-point conversions, and a safety on the Cardinals, but we've also seen the Reds shut out in three consecutive contests by a score of 1-0.
Fortunately, we can pause the numbers as play wrapped up on April 6th and get an excellent comparison to last year's numbers, because we are at the exact same number of contests played in 2025 as we were this time in 2024. The chart below shows some offensive indicators for where things currently stand compared to the same sample-size start of the 2024 season:
STAT | Start of Season '24 | Start of Season '25 |
Contests | 143 | 143 |
PA | 10,894 | 10,764 |
BA | .240 | .239 |
OBP | .317 | .317 |
SLG | .385 | .394 |
BABIP | .290 | .285 |
BB% | 9.2% | 9.3% |
K% | 22.7% | 22.7% |
HR/Contact | 4.1% | 4.6% |
HR/FB | 10.9% | 11.8% |
HR/LD | 9.1% | 9.9% |
Runs/Game | 4.5 | 4.5 |
On Pace HR | 4,962 | 5,470 |
One might have expected to see a larger contrast between the two data sets, but BA/OBP/SLG for each season is close to identical, while the walk and strikeout rates are even closer to one another. Yet this is where things get interesting, because even with nearly identical triple-slashes, runs per game haven't changed despite more homers occurring this season.
This is where the juiced ball claims somewhat fall on my deaf ears, because while we have more home runs, that isn't translating to more average runs per game. Joe Sheehan mentioned in his most recent newsletter that we have seen 42 percent of runs scored on home runs so far this season, while that rate was 37 percent over the course of the first month in 2024 and 39 percent in 2023. Sheehan goes on to note that recent seasons where homers were accounting for greater than 42 percent of runs were 2017, 2019 and 2021. We are once again in an odd-numbered year, so Saberhagenmetrics may be in play, but it may take a leap of faith to believe we are back to those seasons of offensive output.
The four highest single-season home run totals in the post-Mitchell Report era belong to each of the previous four odd-numbered years:
- 2019: 6,776 home runs
- 2017: 6,105 home runs
- 2021: 5,944 home runs
- 2023 5,868 home runs
If the league continues to hit home runs at the current rate, the projected home run total of 5470 would rank seventh behind what happened in 2016 (5610 home runs) and 2018 (5585 home runs.) However, we know that the early season home run rate is not a constant but rather a variable that increases or decreases as the weather warms up. Since 2016, the early season home run rate, as measured by plate appearances divided by home runs, has improved by 6.7 percent over the course of a season. The lowest rate of in-season improvement occurred in 2021 when the in-season rate only changed 3.3 percent, with the largest change happening just this past season as the rest of season rate improved 10.2 percent from the early-season rate:
Season | Early PA/HR | Final PA/HR | Delta |
|---|---|---|---|
2016 | 36.2 | 32.9 | 10.0% |
2017 | 32.5 | 30.4 | 6.9% |
2018 | 36.1 | 33.1 | 9.1% |
2019 | 29.3 | 27.5 | 6.6% |
2020 | 30.2 | 28.9 | 4.5% |
2021 | 31.6 | 30.6 | 3.3% |
2022 | 36.9 | 34.9 | 5.7% |
2023 | 32.7 | 31.4 | 4.0% |
2024 | 37.3 | 33.5 | 10.2% |
2025 | 33.4 | TBD | TBD |
If we applied that same range to this early PA/HR rate, the final PA/HR rate this season could be 32.3 on the high end and 30.0 on the low end. We are on pace for 182,873 plate appearances this season, which is slightly ahead of the 182,606 plate appearances the league has averaged over the past four seasons. If 2025 were to hold somewhere in the range of what we have seen since 2016, the final home run total could be:
- Low end (3.3% change): 5,661 home runs
- Average (6.7% change): 5,870 home runs
- High end: (10.2% change): 6,096 home runs
The high end would put us at the third-highest home run total in recent years and just the third time the league would have exceeded 6,000 homers in a season. The average change would put the league with the fourth-highest total ever, just slightly ahead of 2023 and only trailing 2017, 2019, and 2021, while the low end would still be the sixth-best home run total in league history. The highest single-season changes in home run totals we have seen in recent seasons includes:
- 2016 to 2017: +495 homers
- 2022 to 2023: +653 homers
- 2015 to 2016: +701 homers
- 2018 to 2019: +1,191 homers
It should be an assumed fact by now that we will have more home runs this season than we had last season. The projected improvements above would be a 3.8 percent improvement over 2024 on the low end and an 11.8 percent improvement on the high end over the 5,453 home runs hit league-wide last season. Those rates equate to a range of 208 to 643 more home runs, so those are runs we must factor into our run, RBI and ERA expectations this season. If we do see an improvement this season in the range of what I've calculated, that would still be outside the top three highest year-over-year totals in recent memory. Perhaps the league will remember the game needs singles, too, and won't be so overly reliant upon home runs to score runs, but the larger question is why is the home run rate increasing this season?
The drag on four-seam fastballs is actually higher than most data points last season according to the BaseballSavant Drag Dashboard:
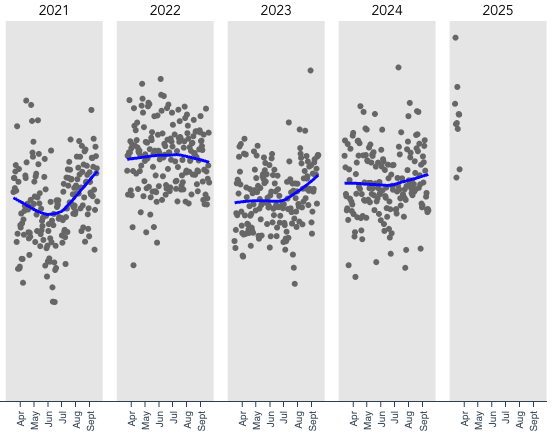
As that page explains:
The performance of the baseball is primarily driven by two factors: the coefficient of restitution ("COR"), which impacts the exit velocity of the ball off the bat, and the drag coefficient, which impacts how far a batted ball carries once struck. All else equal, an increase in COR will lead to greater exit velocities, while an increase in drag will decrease the carry distance. Together, these two properties have a significant impact on the run environment in Major League Baseball and on the home run rate, in particular.
While COR is best measured in laboratory conditions, the drag coefficient of an individual baseball can be estimated using pitch tracking data from Statcast. The chart below shows the average drag coefficient of four-seam fastballs for each regular season date going back to the start of the 2016 season using a method developed by Alan Nathan and David Kagan, which adjusts for environmental conditions. Here we include only four seam fastballs to better account for drag variability based on the spin rate of the pitch.
We don't have public COR data to look at, but the fact that we're seeing a higher home run rate right now than we witnessed this same time last season is quite interesting since there is a higher Drag Coefficient. So, let's look at the batted ball data for quality of contact. The table below shows the data on flyballs and line drives that are also graded as barreled or solid contact by BaseballSavant. This is comparing data over the same dates in 2024 and 2025:
SEASON | AVG EXIT VELO | AVG DIST |
|---|---|---|
2024 | 104.5 | 354 |
2025 | 103.5 | 356 |
The league is not striking the ball any harder to start the season this year than it did last season, but the ball is on average traveling slightly further. Perhaps the COR of the baseball is leaning to the super-happy-fun-ball era even while the drag of the baseball is so far much higher than we've seen compared to most starts to the season.
In conclusion, I don't feel the ball is juiced, but strange things are afoot at the Circle K with outcomes thus far. How much of the change is being influenced by two completely new ballparks in the American League as well as the adjusted dimensions of an existing park, or the continued league-wide increase in pulled flyballs, remains to be seen. Stephen Sutton-Brown has run some data through models showing there is no evidence the ball is juiced when looking at exit velocities as sugggested by Dr. Alan Nathan:
We're not going to see the home run rate decline in-season, so the fact that homers are up means we're going to see a notable increase in homers this season compared to 2024. Early indicators should lead us to planning for more home runs this season, but how that impacts the overall runs per game will depend upon whether the league can improve its overall on-base percentage with more base hits, because they're noticeably absent again to the start this season despite the empty promises of the shift ban.